
Keyword
tourism
35 record(s)
Type of resources
Available actions
Topics
Keywords
Contact for the resource
Provided by
Representation types
Update frequencies
Status
Scale
GEMET keywords
-
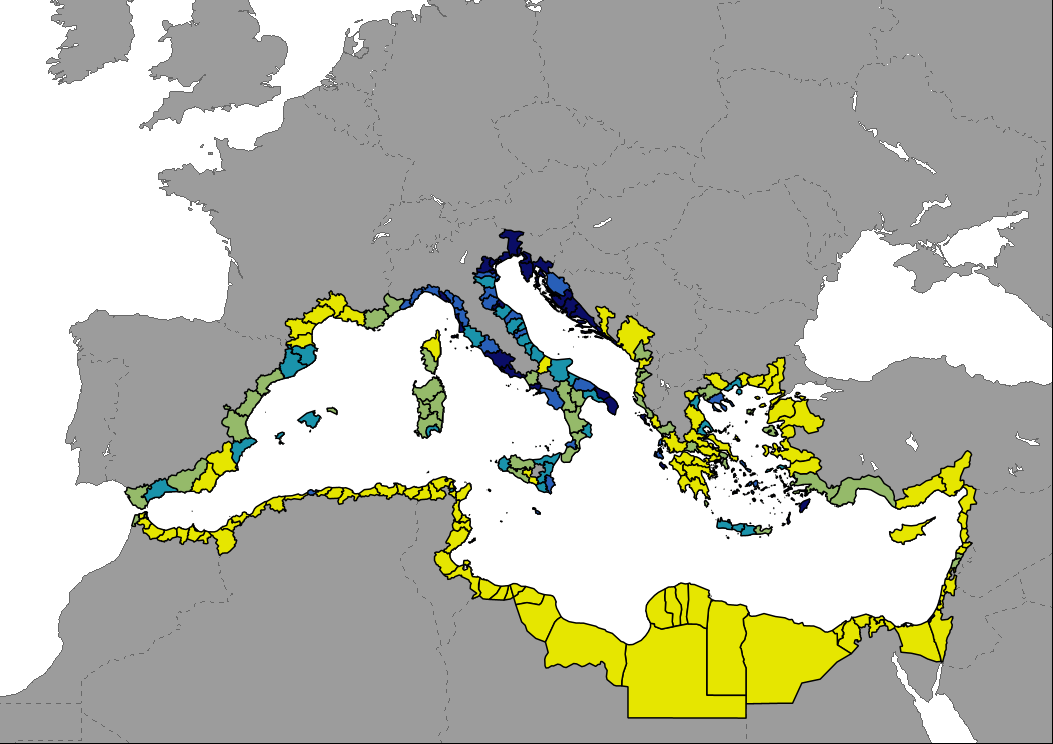
Data representing the number of tourism establishments per km2 in Mediterranean countries indicating the capacity of regional tourism infrastructure. Estimation made from a disaggregation of data at NUTS2 (EU countries) or national level (non-EU countries) based on the distribution of accommodation sites available in OpenStreetMap. Countries without data were estimated according to the number of accommodation sites. Last year reported for most non-EU countries and certain regions of France, Spain and Turkey is 2021 (2019 for Egypt and Montenegro).
-
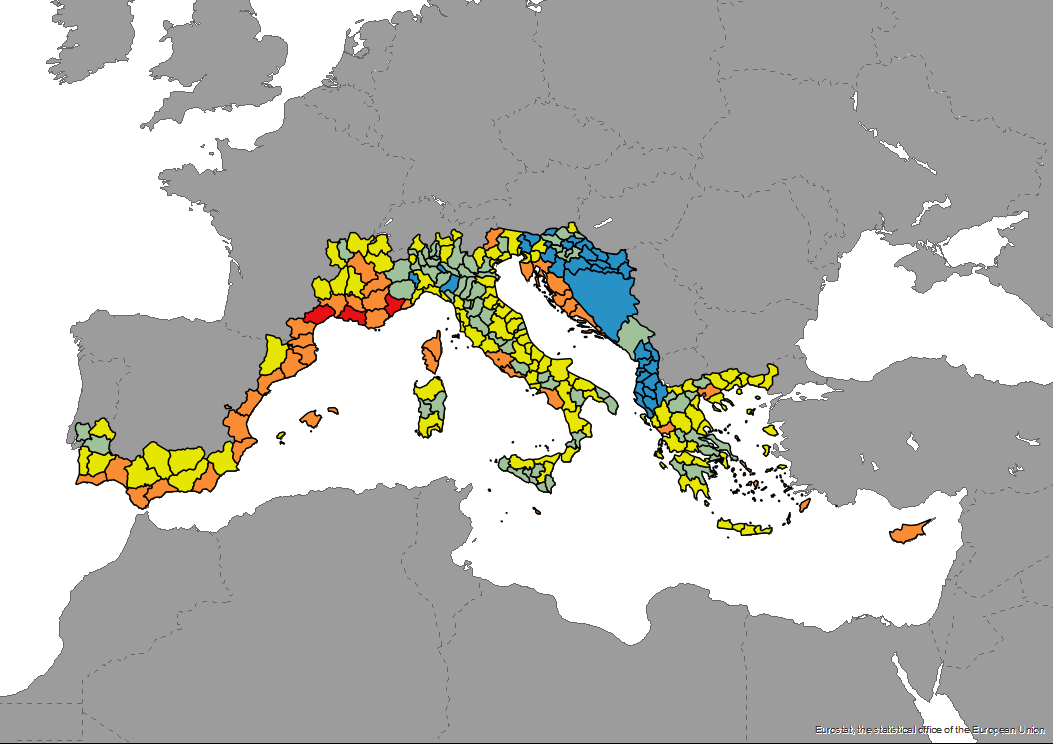
The dataset of the ecological vulnerability to tourism by NUTS3 areas is produced in the framework of DestiMED PLUS. DestiMED PLUS Project builds on the successes of MEET and DestiMED projects and aims to improve levels of integration between regional tourism and conservation policies in the protected areas of 9 Mediterranean Regions through the creation of ecotourism itineraries which are developed using a collaborative approach, both locally and regionally to develop ecotourism.
-

The dataset of the number of cruise passengers in Mediterranean ports in 2018, including both those who start/end a cruise and those who are on excursion is produced in the framework of DestiMED PLUS. DestiMED PLUS Project builds on the successes of MEET and DestiMED projects and aims to improve levels of integration between regional tourism and conservation policies in the protected areas of 9 Mediterranean Regions through the creation of ecotourism itineraries which are developed using a collaborative approach, both locally and regionally to develop ecotourism.
-

Data shows the number of nights spent at tourist accommodation establishments per km2 in Mediterranean countries. Estimation made from a disaggregation of data at NUTS2 based on the distribution of accommodation sites available in OpenStreetMap.
-
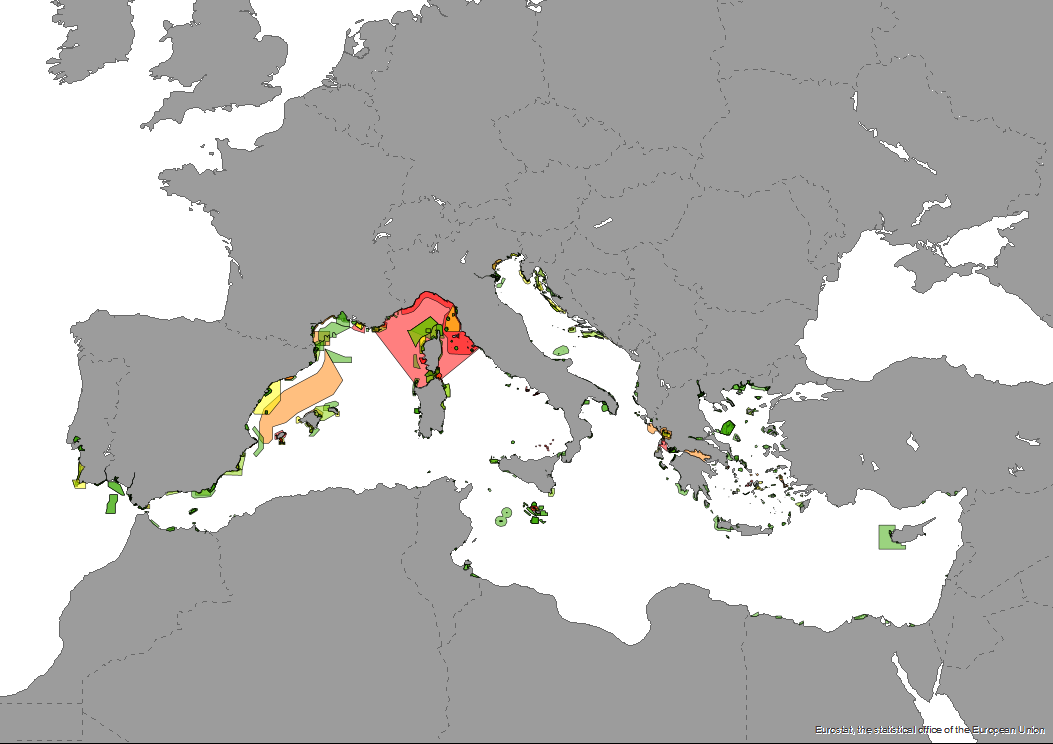
The dataset of the ecological vulnerability of Marine Protected Areas (MPAs) based on mean pleasure craft traffic intensity in 2018, expresed as hours per month is produced in the framework of DestiMED PLUS. DestiMED PLUS Project builds on the successes of MEET and DestiMED projects and aims to improve levels of integration between regional tourism and conservation policies in the protected areas of 9 Mediterranean Regions through the creation of ecotourism itineraries which are developed using a collaborative approach, both locally and regionally to develop ecotourism.
-
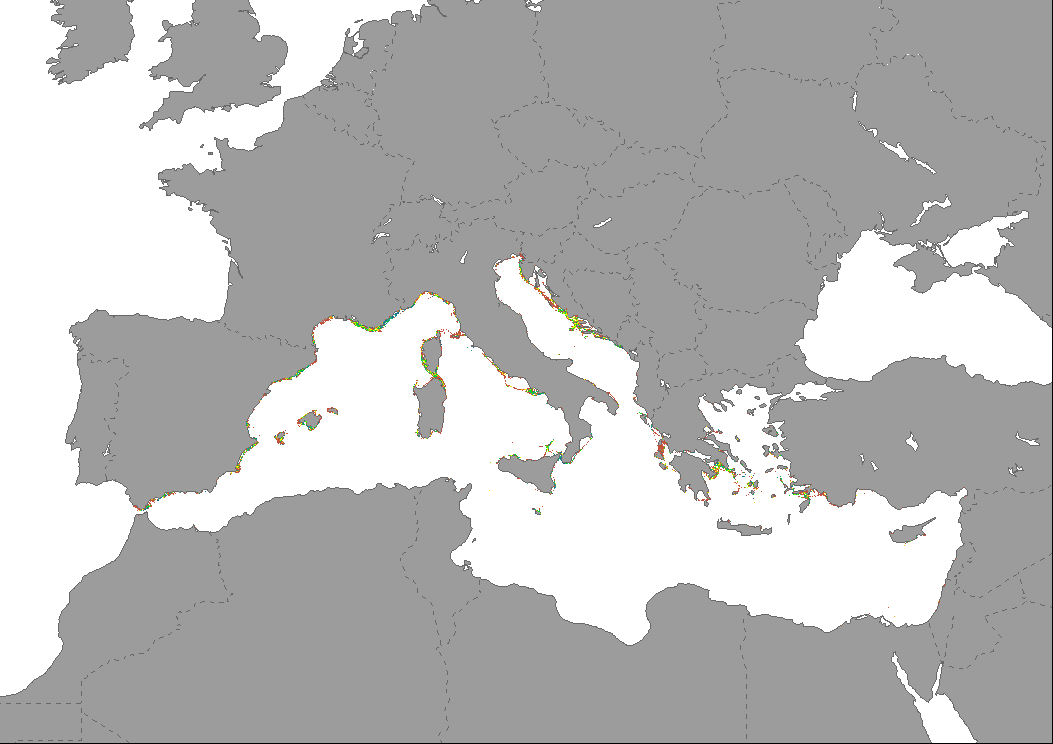
Data represents the percentage of change in the intensity of sailing vessels and pleasure craft traffic in the Mediterranean Sea between years 2019 and 2022. The map is based on AIS data aggregated at 1km2 by EMODnet and expressed as total time with presence of vessels in each cell throughout the year.
-

Data showing the percentage of change in the number of tourists arrivals in Mediterranean countries. Data are mostly available by coastal NUTS2 regions for years 2019 and 2022. Data for non European Union countries are available at country level, but only coastal regions are shown on the map to highlight them. Last year reported for Syria and certain regions of Turkey is 2021.
-
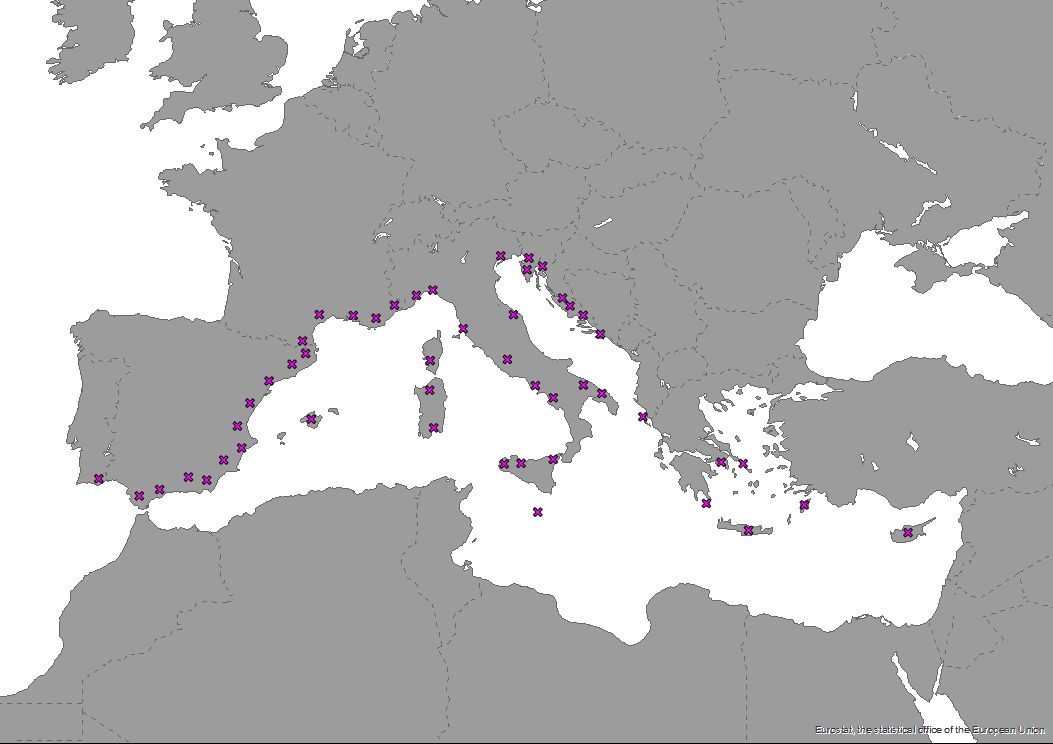
The dataset of The MED cooperation area NUTS3 regions as points is produced in the framework of DestiMED PLUS. DestiMED PLUS Project builds on the successes of MEET and DestiMED projects and aims to improve levels of integration between regional tourism and conservation policies in the protected areas of 9 Mediterranean Regions through the creation of ecotourism itineraries which are developed using a collaborative approach, both locally and regionally to develop ecotourism.
-

Vulnerability is calculated based on the percentage of Key Biodiversity Areas (KBAs) and the cumulative tourism pressure in each region. Percentage of KBAs not protected, with respect to the region, are classified into five groups, from very low to very high, according to the following thresholds: lower than 10%, 10 to 17%, 17 to 30%, 30 to 50% and higher than 50%. Theses classes and those of cumulative pressure are combined into a weighted sum and then reclassified in five vulnerability categories, from very low to very high.
-

Data showing the number of tourists arrivals per km2 in Mediterranean countries indicating the demand of regional tourism infrastructure. Estimation made from a disaggregation of data at NUTS2 (EU countries) or national level (non-EU countries) based on the distribution of accommodation sites available in OpenStreetMap. Last year reported for most non-EU countries and certain regions of France and Turkey is 2021 (2015 for Egypt).