
Keyword
environmental impact of tourism
22 record(s)
Type of resources
Available actions
Topics
Keywords
Contact for the resource
Provided by
Representation types
Update frequencies
Status
Scale
GEMET keywords
-
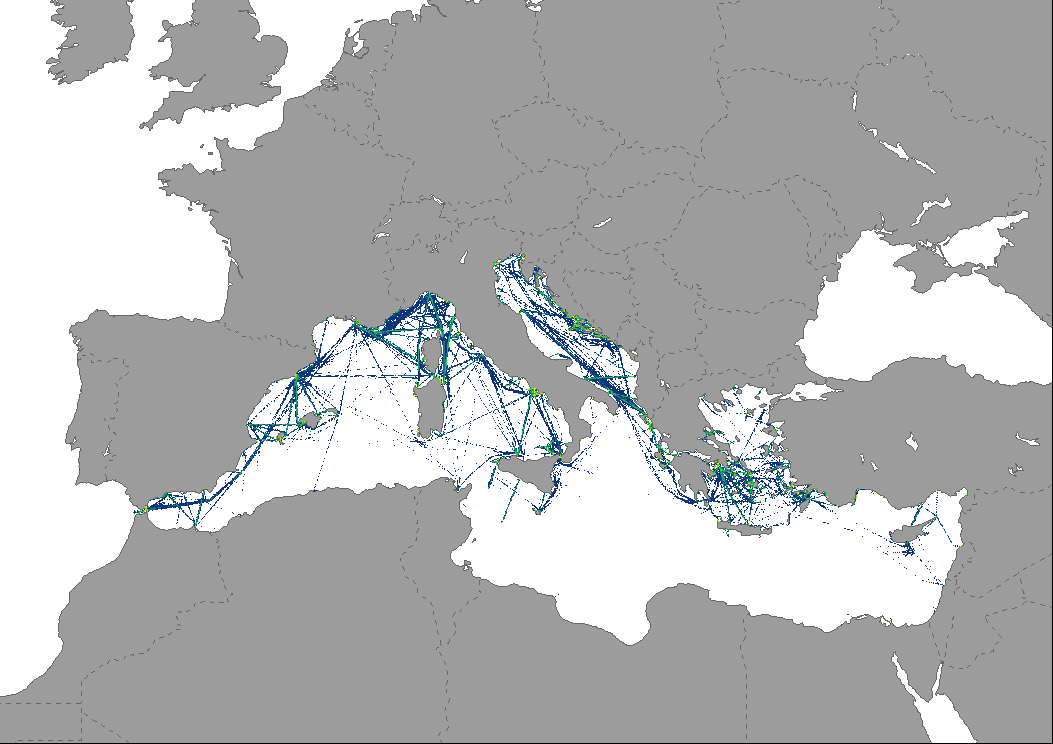
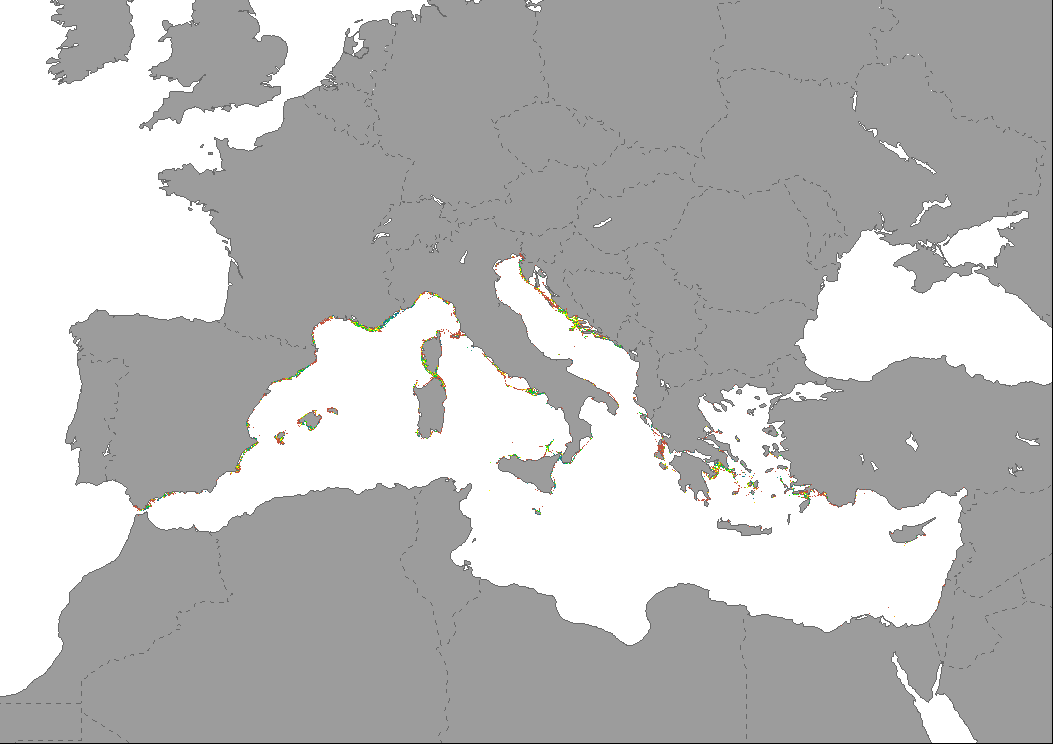
Data representing the cumulative tourism pressure in Mediterranean Sea waters based on the intensity of maritime traffic of passengers vessels and pleasure craft. Traffic intensity was produced using AIS data aggregated at 1km2 by EMODnet and expressed as total time with presence of vessels in each cell throughout the year (hours/km2). Pressure hotspots are highlighted on the map, being classified as: 1) low; areas with cumulative presence of vessels from one hour a day to 4 months (1 quarter); 2) moderate; areas with cumulative presence of vessels between 4 and 8 months (1 to 2 quarters); 3) high, areas with cumulative presence of vessels between 8 months (2 quarters) and one year; 4) very high, areas where there is a cumulative presence of vessels exciding one year, being locations of very high traffic intensity.
-
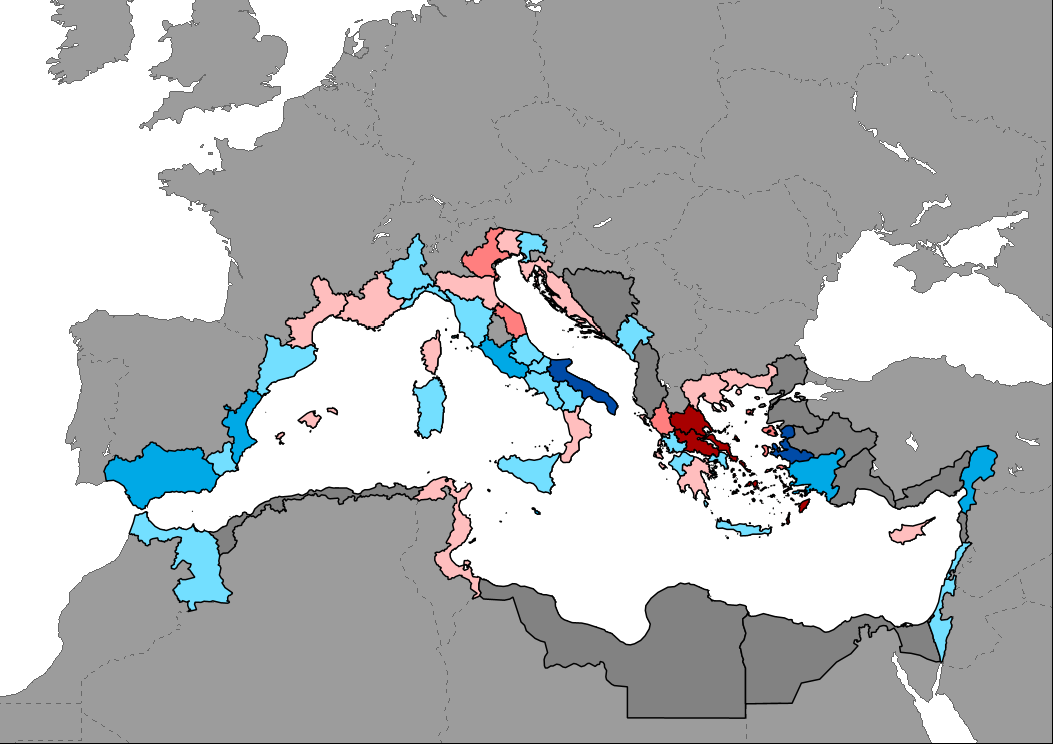
Data shows the change in number of tourism establishments between year 2019 and 2022. Data are mostly available by coastal NUTS2 region. Data for non European Union countries are available at country level, but only coastal regions are shown on the map to highlight them.
-
Data represents the degree of pressure based on the intensity of passengers vessels, including high speed craft, in the Mediterranean Sea (year 2022). The map is based on AIS data aggregated at 1km2 by EMODnet and expressed as total time with presence of vessels in each cell throughout the year. The indicator provides an estimate of the amount of pollution vessels produce (via fuel leaks, oil discharge, waste disposal, etc.), under the assumption that traveling ships primarily affect their immediate waters.
-
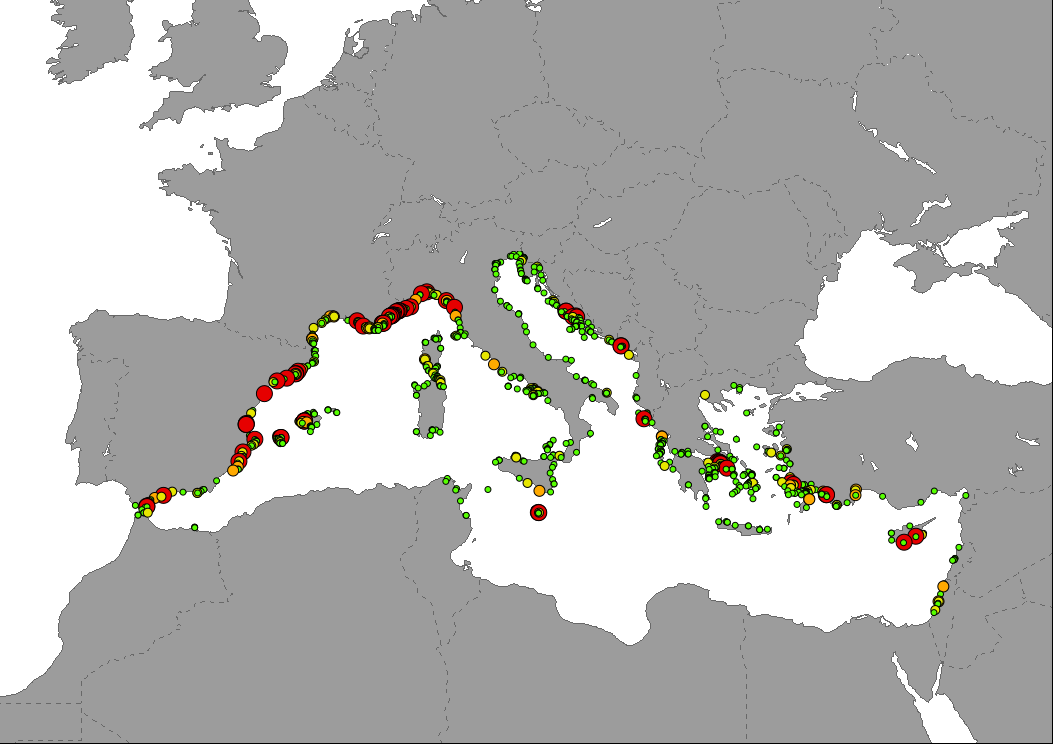
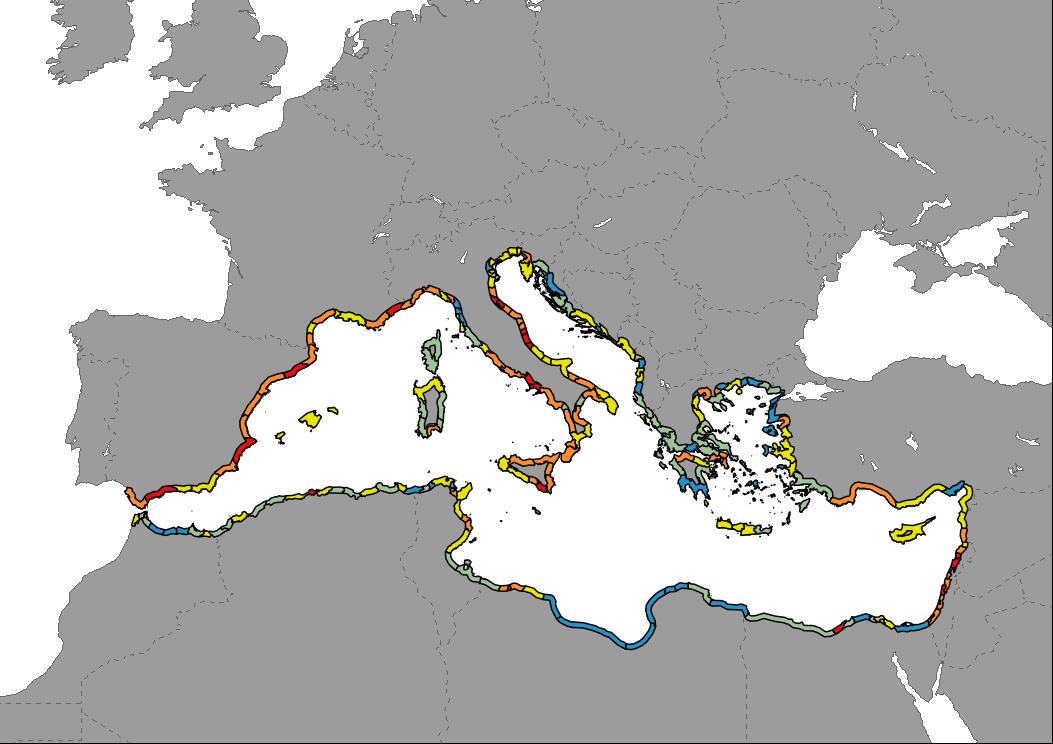
Data represents the number of moorings in marina ports per kilometre of coastline for each NUTS3 or equivalent (e.g. province) region. The total number of moorings was obtained from the data compiled by ETC-UMA on the location and capacity of the marinas, assigning each port its corresponding NUTS3 code and counting the total number of moorings. This value was divided by the length of the region's coastline in km. Results show low to high intensive capacity for this activity by region.
-
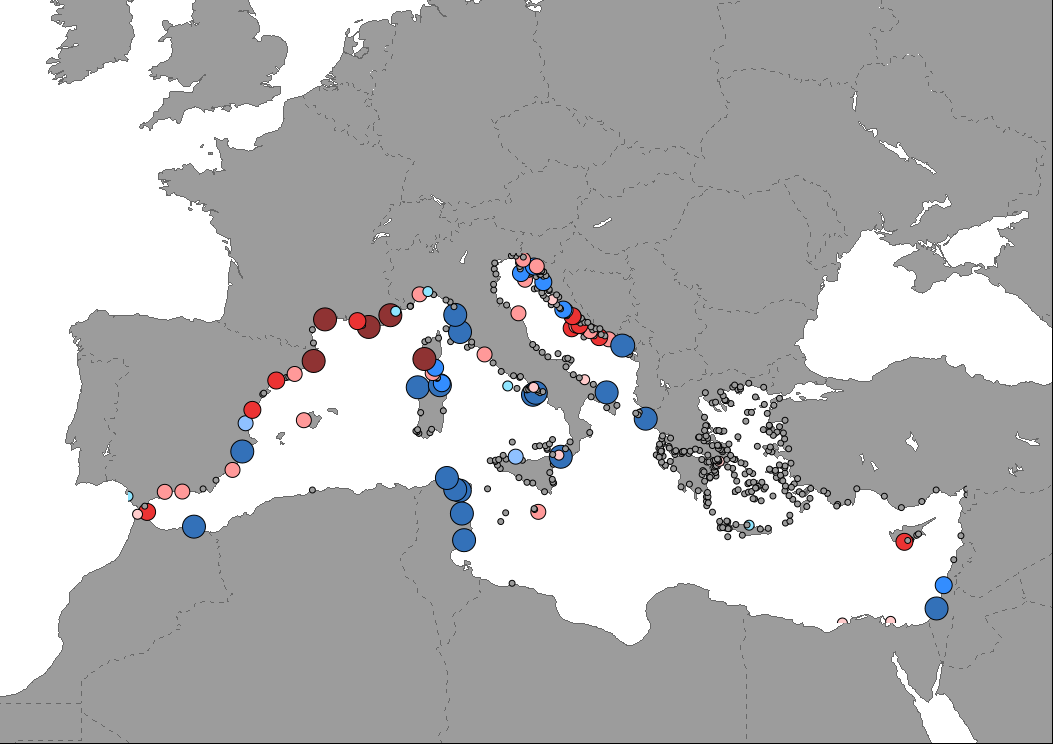
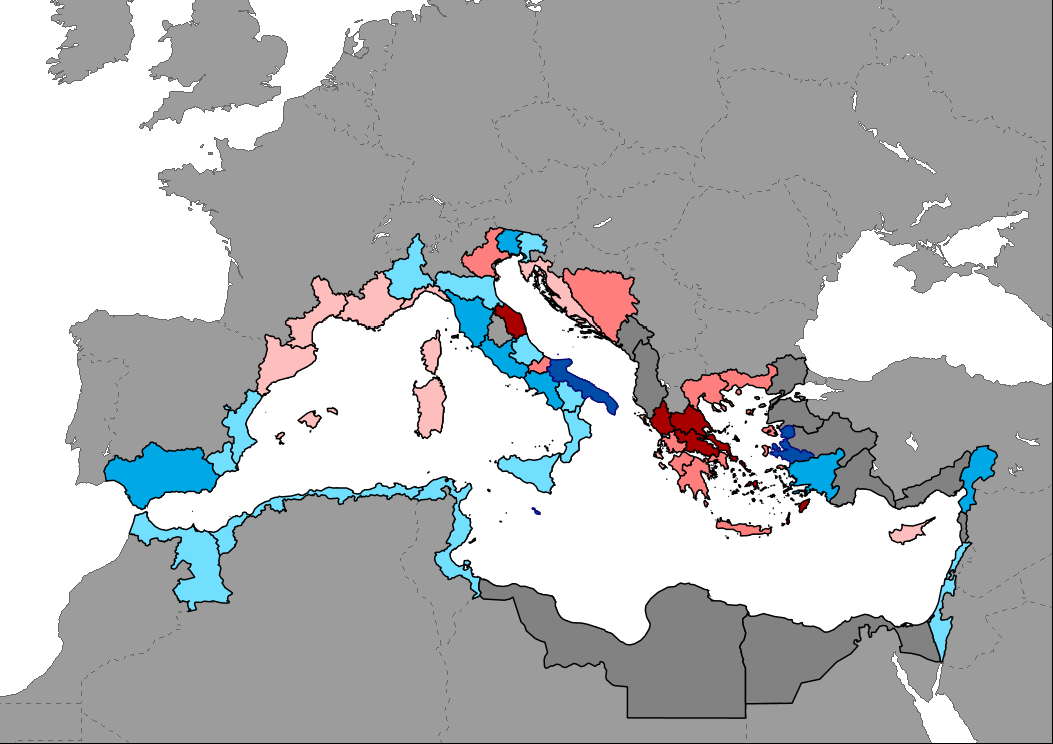
Data representing the percentage change in number of cruise passengers in Mediterranean ports between years 2019 and 2022, including both those who start/end a cruise and those who are on excursion.
-
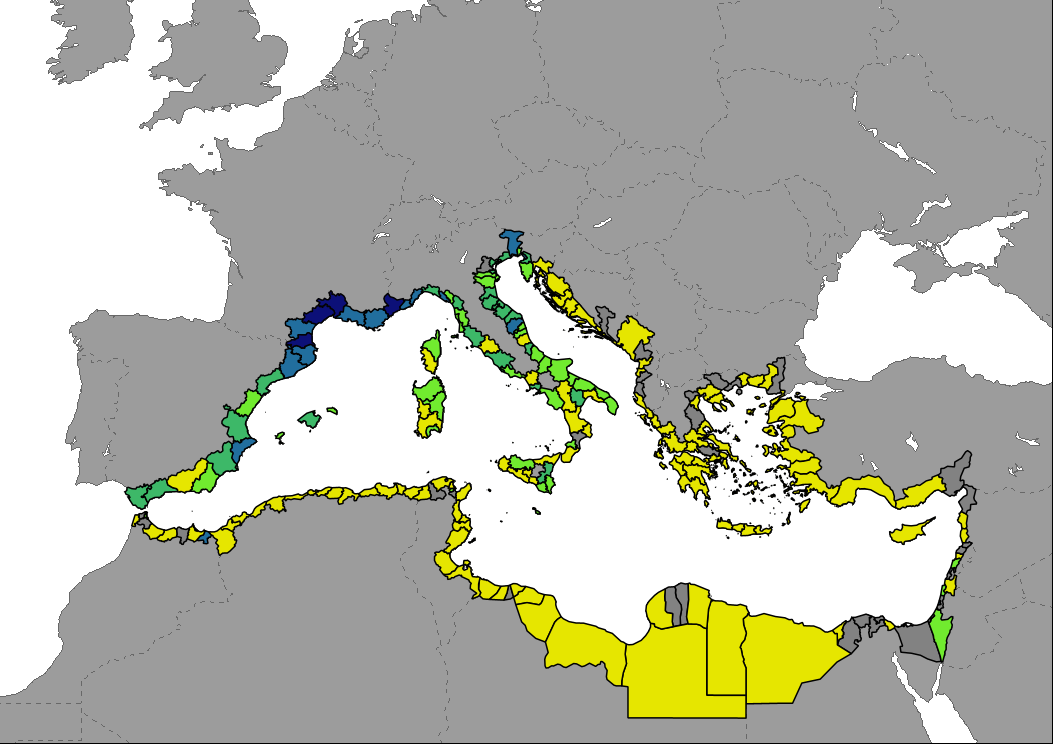
Data shows the percentage of built up area in the first 1km of the coastal strip of the Mediterranean region by NUTS3 or equivalent region in 2019. Values were calculated by a 100m pixel count for the "Built-up" class of the Copernicus Global Land Cover. Coast belt is shown with a distance of 25km for mapping reasons.
-
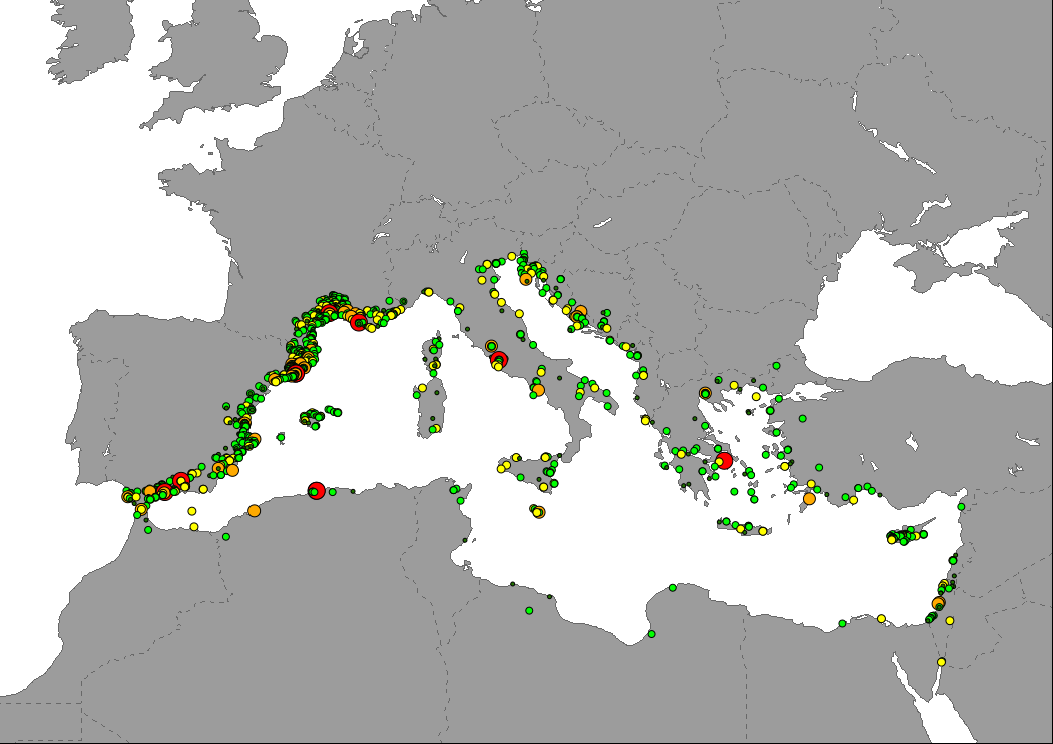
Data showing the distibution of tourism hotspots based on the location of accomodation and attractions sites available in OpenStreetMap counted per km2. Areas without data cannot be interpreted as an absence of tourism activities, but as unmapped areas.
-
Data showing the percentage of change in the number bed-places in Mediterranean countries between years 2019 and 2022. Data are mostly available by coastal NUTS2 regions. Data for non European Union countries are available at country level, but only coastal regions are shown on the map to highlight them. Last year reported for most non-EU countries and certain regions of France and Turkey is 2021 (2015 for Egypt).
-

Vulnerability is calculated based on the coverage of protected areas (PAs) and Important Areas for Biodiversity (IABs) and the cumulative tourism pressure in the Mediterranean Sea waters. PAs and IABs coverage is reclassified in scores, 1 and 2 respectively. These classes and those of cumulative pressure are combined in and reclassified into vulnerability classes according to a vulnerability matrix. IABs include: Key Biodiversity Areas (KBAs), Important Shark and Ray Areas (ISRAs), Important Marine Mammal Areas (IMMAs), Critical areas for the orca population of the Gibraltar Strait and Gulf of Cádiz, Biosphere Reserve, Cetaceans Critical Habitat, Ecologically or Biologically Significant Marine Areas (EBSAs), Particularly Sensitive Sea Areas (PSSAs), Proposed Sites of Community Importance, and World Heritage Sites.
-
Data represents the percentage of change in the intensity of sailing vessels and pleasure craft traffic in the Mediterranean Sea between years 2019 and 2022. The map is based on AIS data aggregated at 1km2 by EMODnet and expressed as total time with presence of vessels in each cell throughout the year.