Keyword
tonnage of vessels
2 record(s)
Type of resources
Available actions
Topics
Keywords
Contact for the resource
Provided by
Formats
Representation types
Update frequencies
Status
Scale
panaceaKeywords
GEMET keywords
-

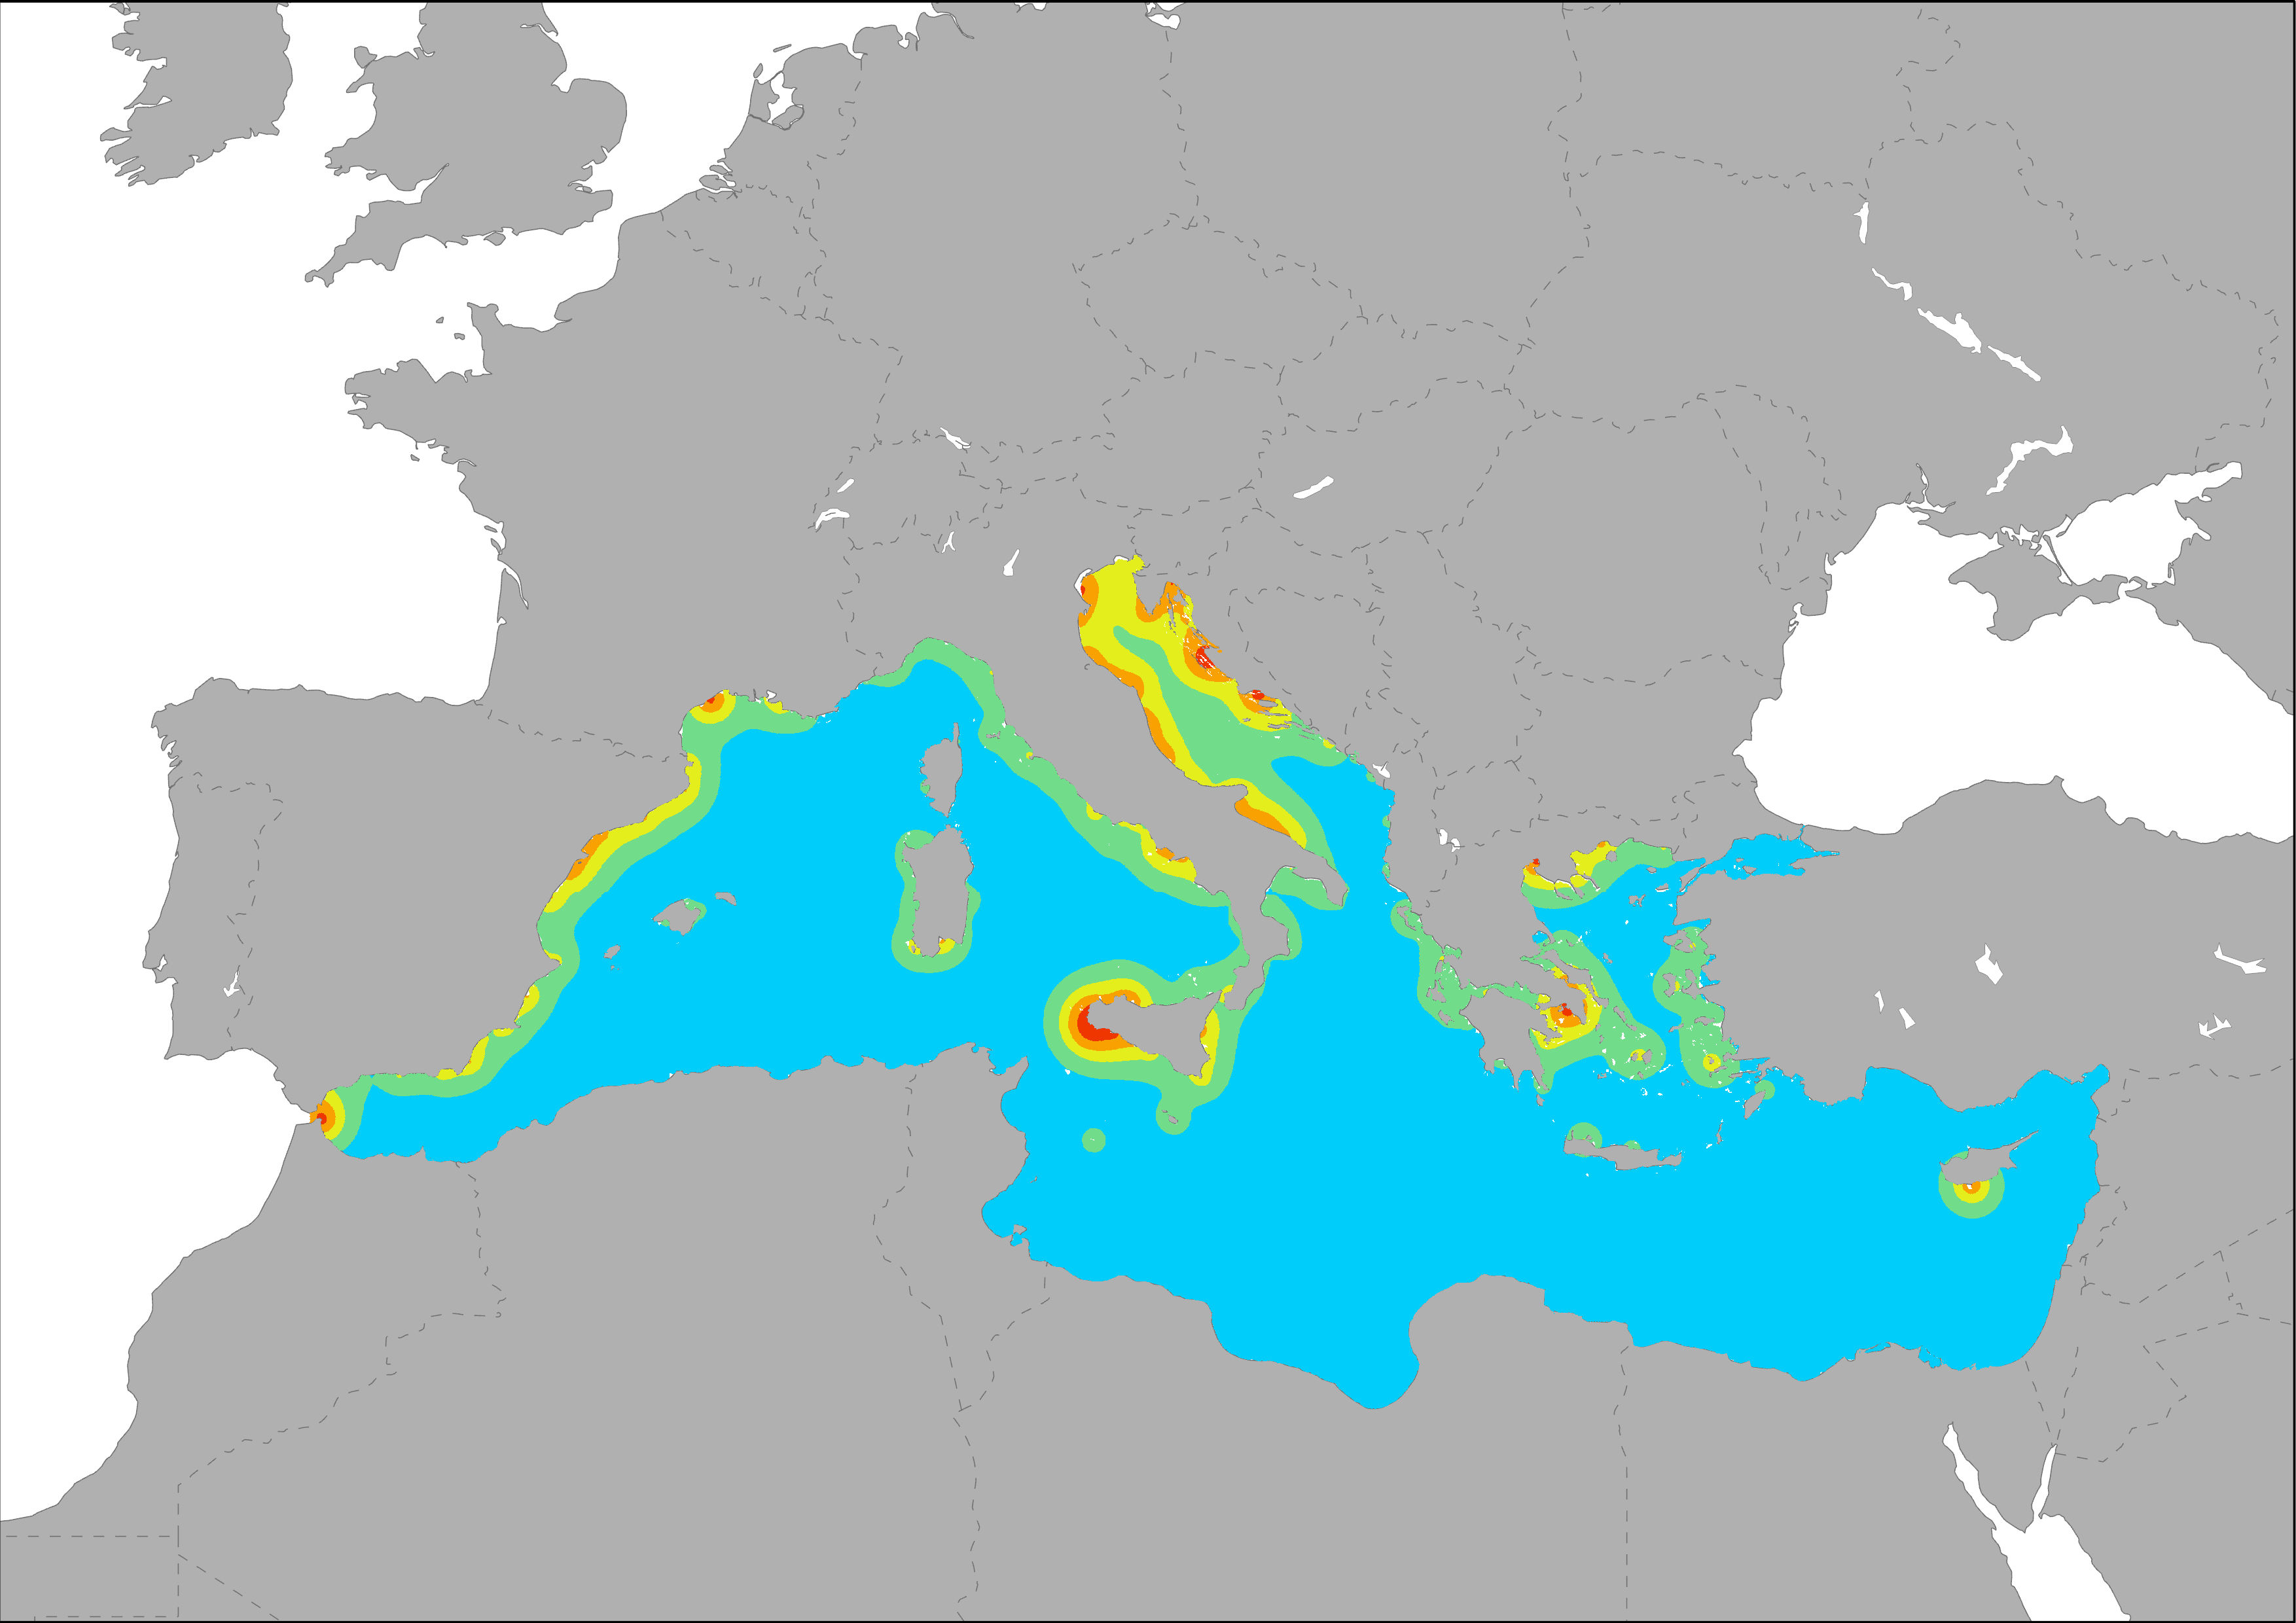
The map shows the distribution of main fishing ports in the Mediterranean Sea and its corresponding area of pressure (based on self calculations using the total capacity: tonnage of vessels, DG MARE, 2014). The influence of fishing activity was modeled as a buffer with and exponential decay based on self calculations using the total capacity of the fleet: tonnage of vessels (in gross tonnage, GT). This indicator is based on fleet stats of DG MARE, 2014. Calculations were made following the same methodology developed for ESaTDOR Project (ESPON, 2013).
-

The map shows the distribution of main fishing ports in the Mediterranean Sea. Ports are ranked by tonnage per vessel (total gross tonnage, GT/number of vessels). This indicator is based on fleet stats of DG MARE, 2014.
