
Topic
environment
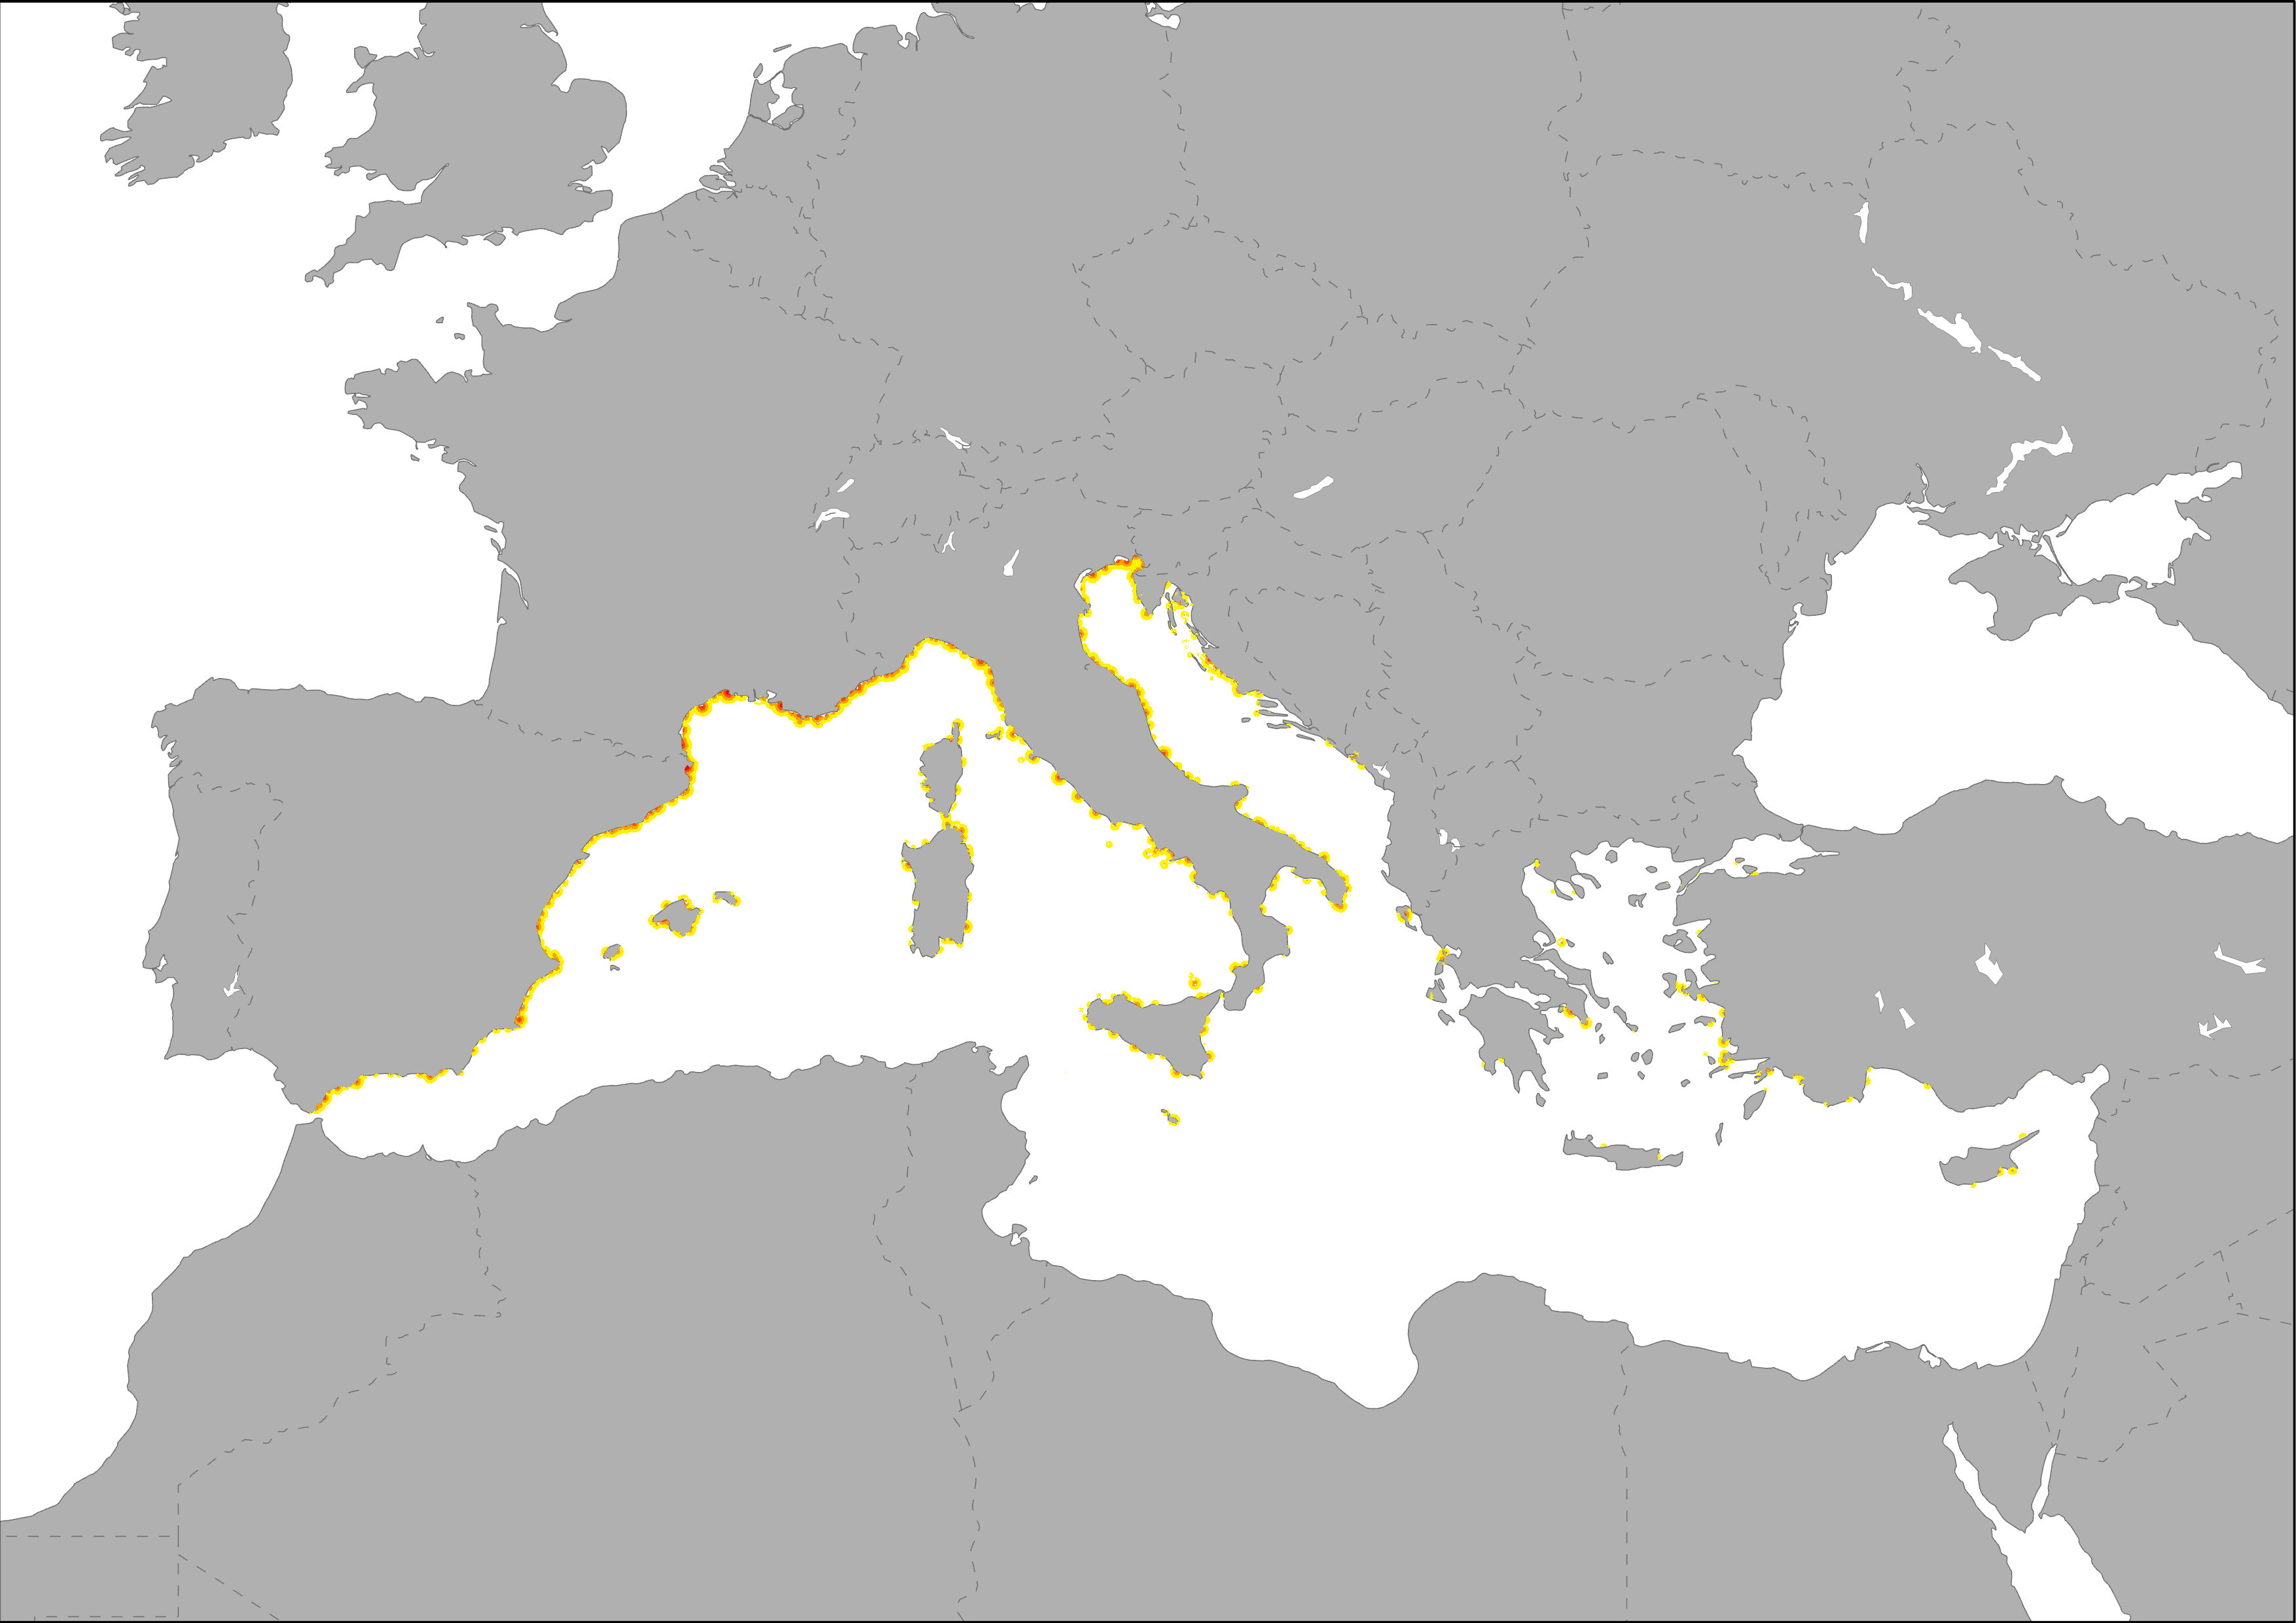
129 record(s)
Type of resources
Available actions
Topics
Keywords
Contact for the resource
Provided by
Years
Formats
Representation types
Update frequencies
Status
Scale
Resolution
panaceaKeywords
GEMET keywords
-
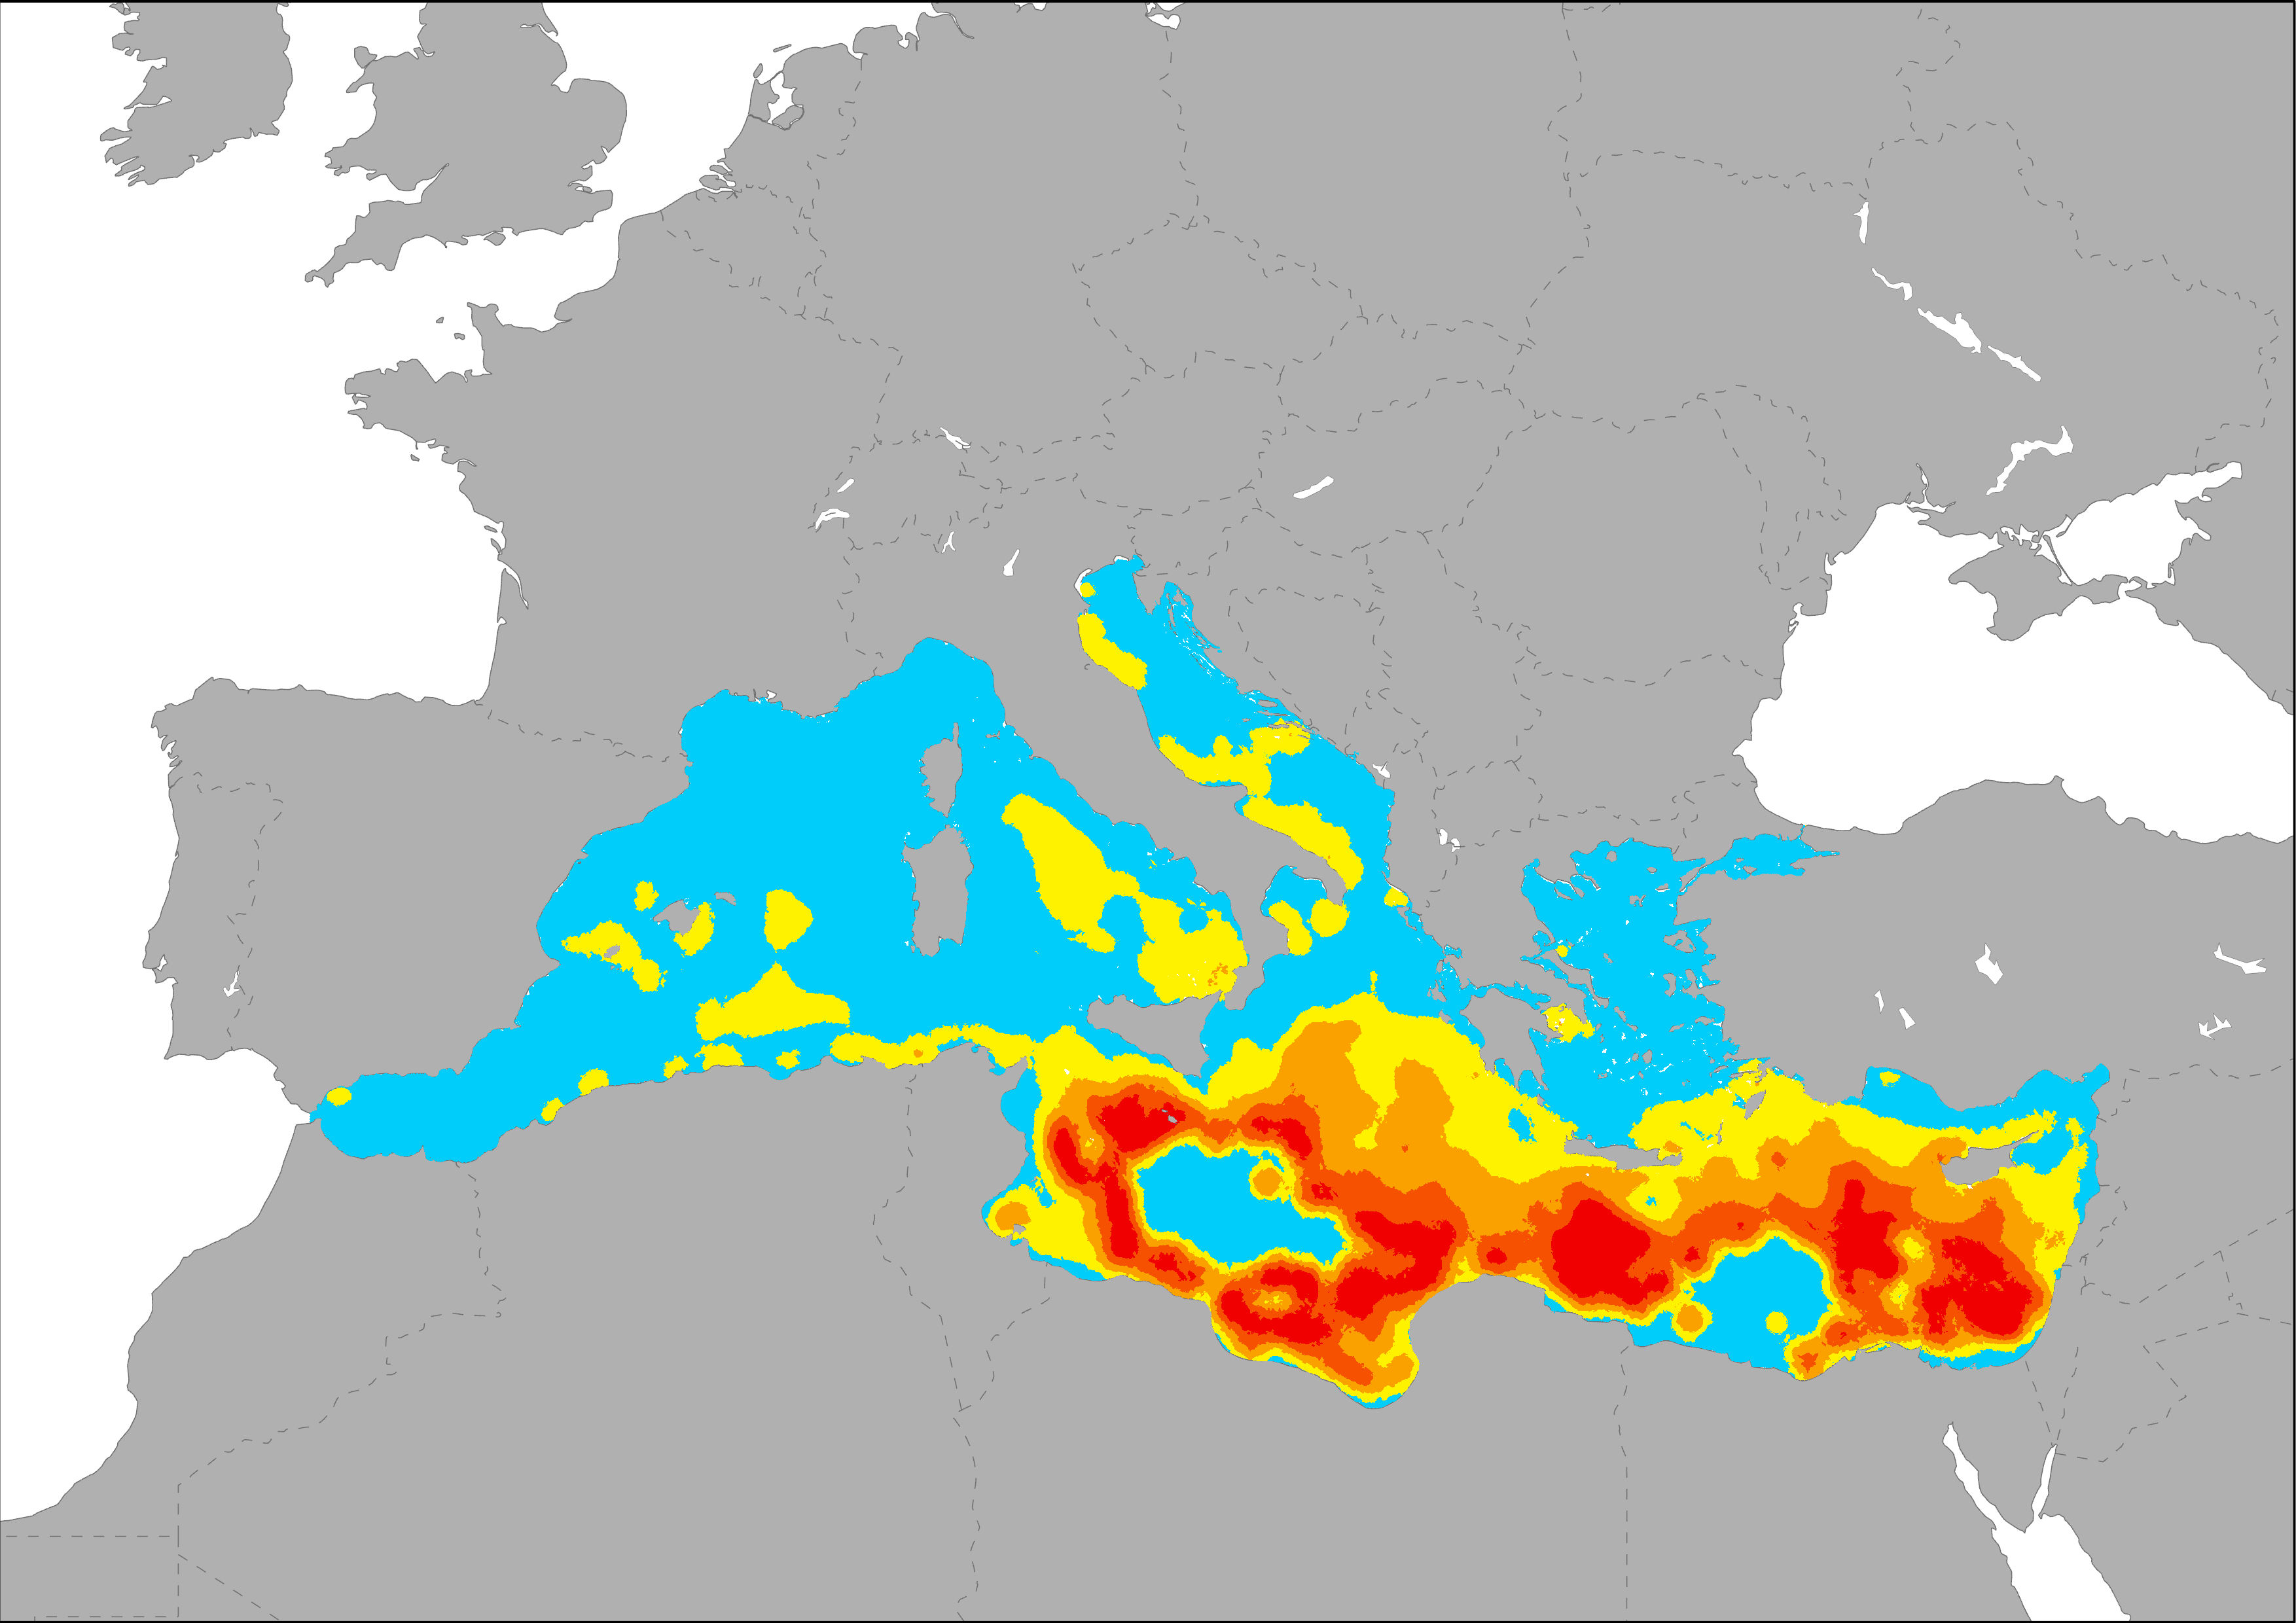
Map showing bed places per km2 as an indicator of the local intensity of tourism capacity. This index is based on Eurostat tourism statistic on bed places and the DMSP-OLS Nighttime Lights Time Series image. Eurostat's tourism capacity statistics differentiate between coastal and non-coastal areas within a NUTS2 region. The total number of beds in coastal areas of a NUTS2 region was disaggregated to the most intense nighttime light emission pixels of the Nighttime Lights Time Series assuming that most bed places are located in areas with high nighttime light emissions. Results are showing low to high intensive tourism capacity per km2 pixel.
-
The map shows the spatial distribution of the frequency of oil spills in the Mediterranean Sea, indicating where the probability of an oil discharge is higher. Oil spills were represented as a density layer calculated using data on ship accidents and oil discharges registered by the Mandate of the Regional Marine Pollution Emergency Response Centre for the Mediterranean Sea (REMPEC), and also the oil spills map generated by Cinirella et al., 2012 (based on JRC data, 2009).
-
The indicators represent the distribution and degree of accumulation of marine in the Mediterranean Sea. Main source data were modelled by Lebreton et al., 2012 using a Lagrangian particle tracking model to simulate 30 years of input and transport of floating debris in the world’s ocean. The relative contribution of different sources to the total amount was taken into account in their model.
-
The map shows the distribution of main ferry ports in the Mediterranean Sea. Pressure on marine regions are represented by the port influence area, based also on their activity level. The dispersal of port-derived pollution was modeled as a diffusive plume based on their activity level using Eurostat data on transport of goods (thousand tonnes) and passengers (thousand passengers). Calculations were made following the same methodology developed for ESaTDOR Project (ESPON, 2013).
-

The map shows the distribution of main passengers transport ports in the Mediterranean Sea. Pressure on marine regions are represented by the port influence area, based also on their activity level. The dispersal of port-derived pollution was modeled as a diffusive plume based on their activity level using Eurostat data on transport of goods (thousand tonnes) and passengers (thousand passengers). Calculations were made following the same methodology developed for ESaTDOR Project (ESPON, 2013).
-
The indicators represent the distribution and degree of accumulation of marine in the Mediterranean Sea. Main source data were modelled by Lebreton et al., 2012 using a Lagrangian particle tracking model to simulate 30 years of input and transport of floating debris in the world’s ocean. The relative contribution of different sources to the total amount was taken into account in their model.
-
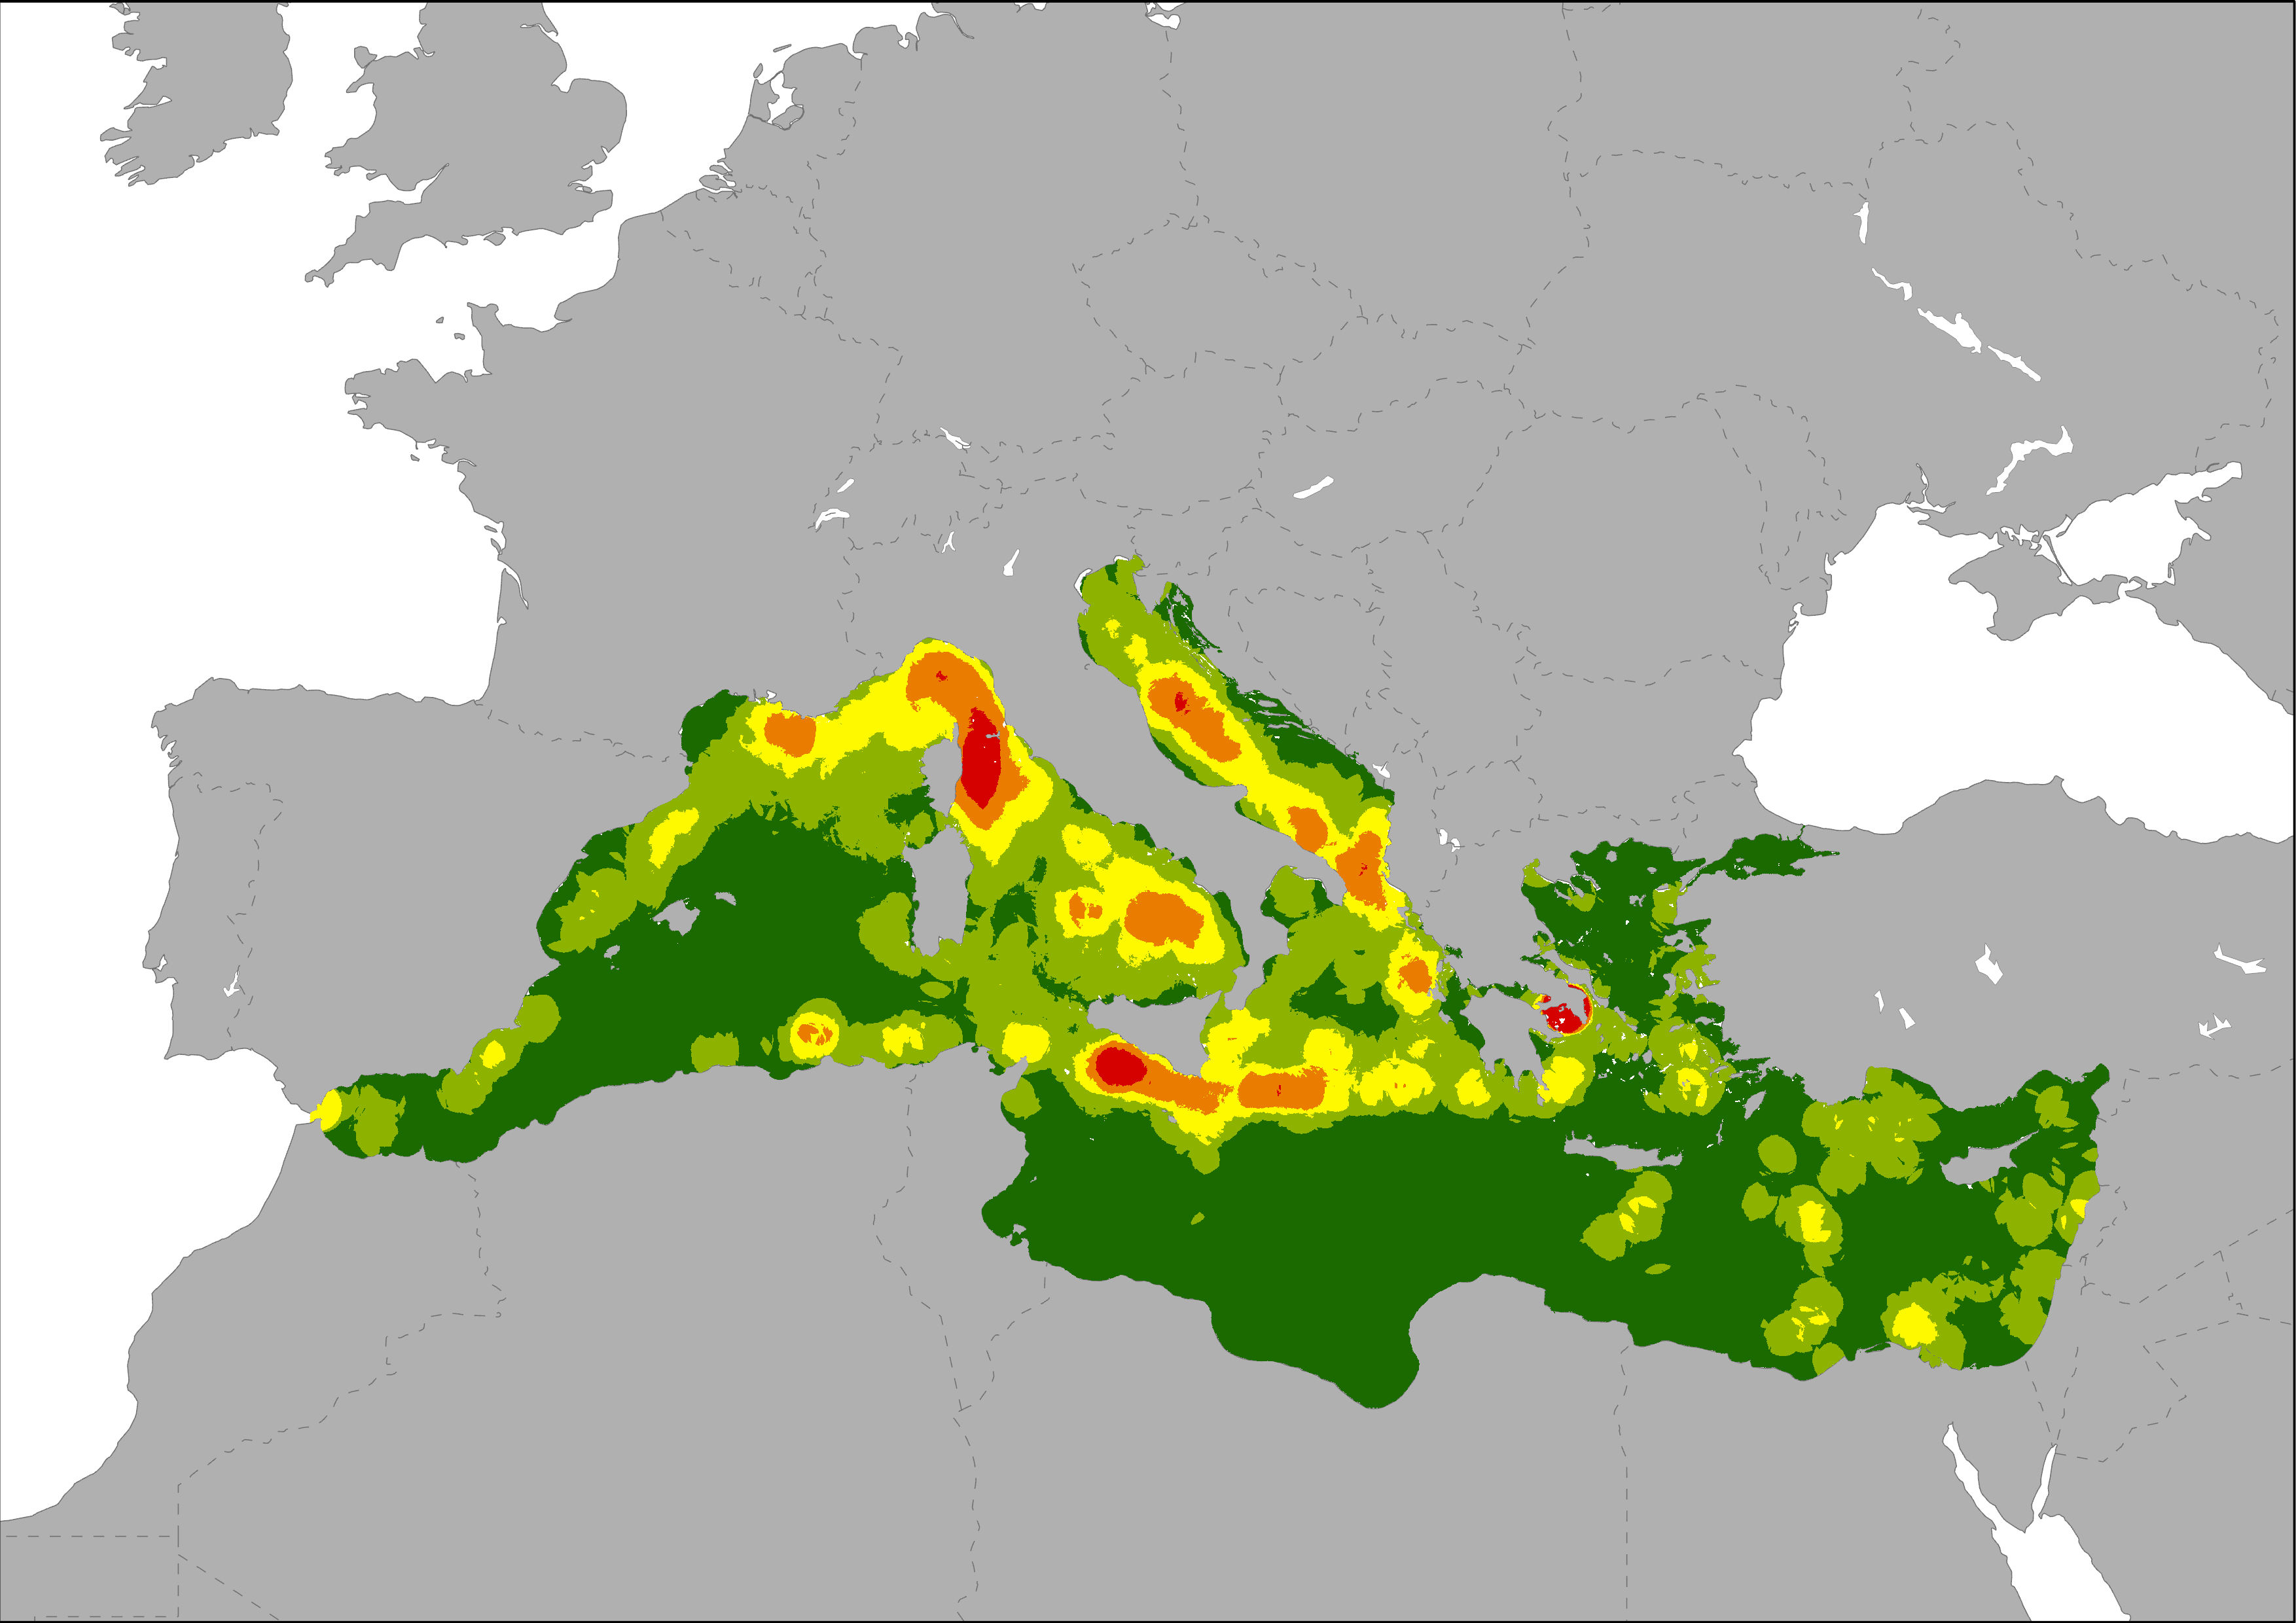
The map represents the degree of pressure based on the intensity of transport in the Mediterranean Sea. Three variables were taken into account: vessels traffic, port activity and oil spills. Shipping data (Halpern et al., 2008) provide an estimate of the occurrence of ships at a particular location, and therefore an estimate of the amount of pollution they produce, under the assumption that traveling ships primarily affect their immediate waters. The dispersal of port-derived pollution was modeled as a diffusive plume based on data of transport of goods (thousand tonnes) and passengers (thousand passengers). Pressures generated by oil spills and other pollution releases are represented as a density layer based on data registered by the REMPEC, and also the oil spills map generated by Cinirella et al, 2012 (based on JRC 2009 data).
-
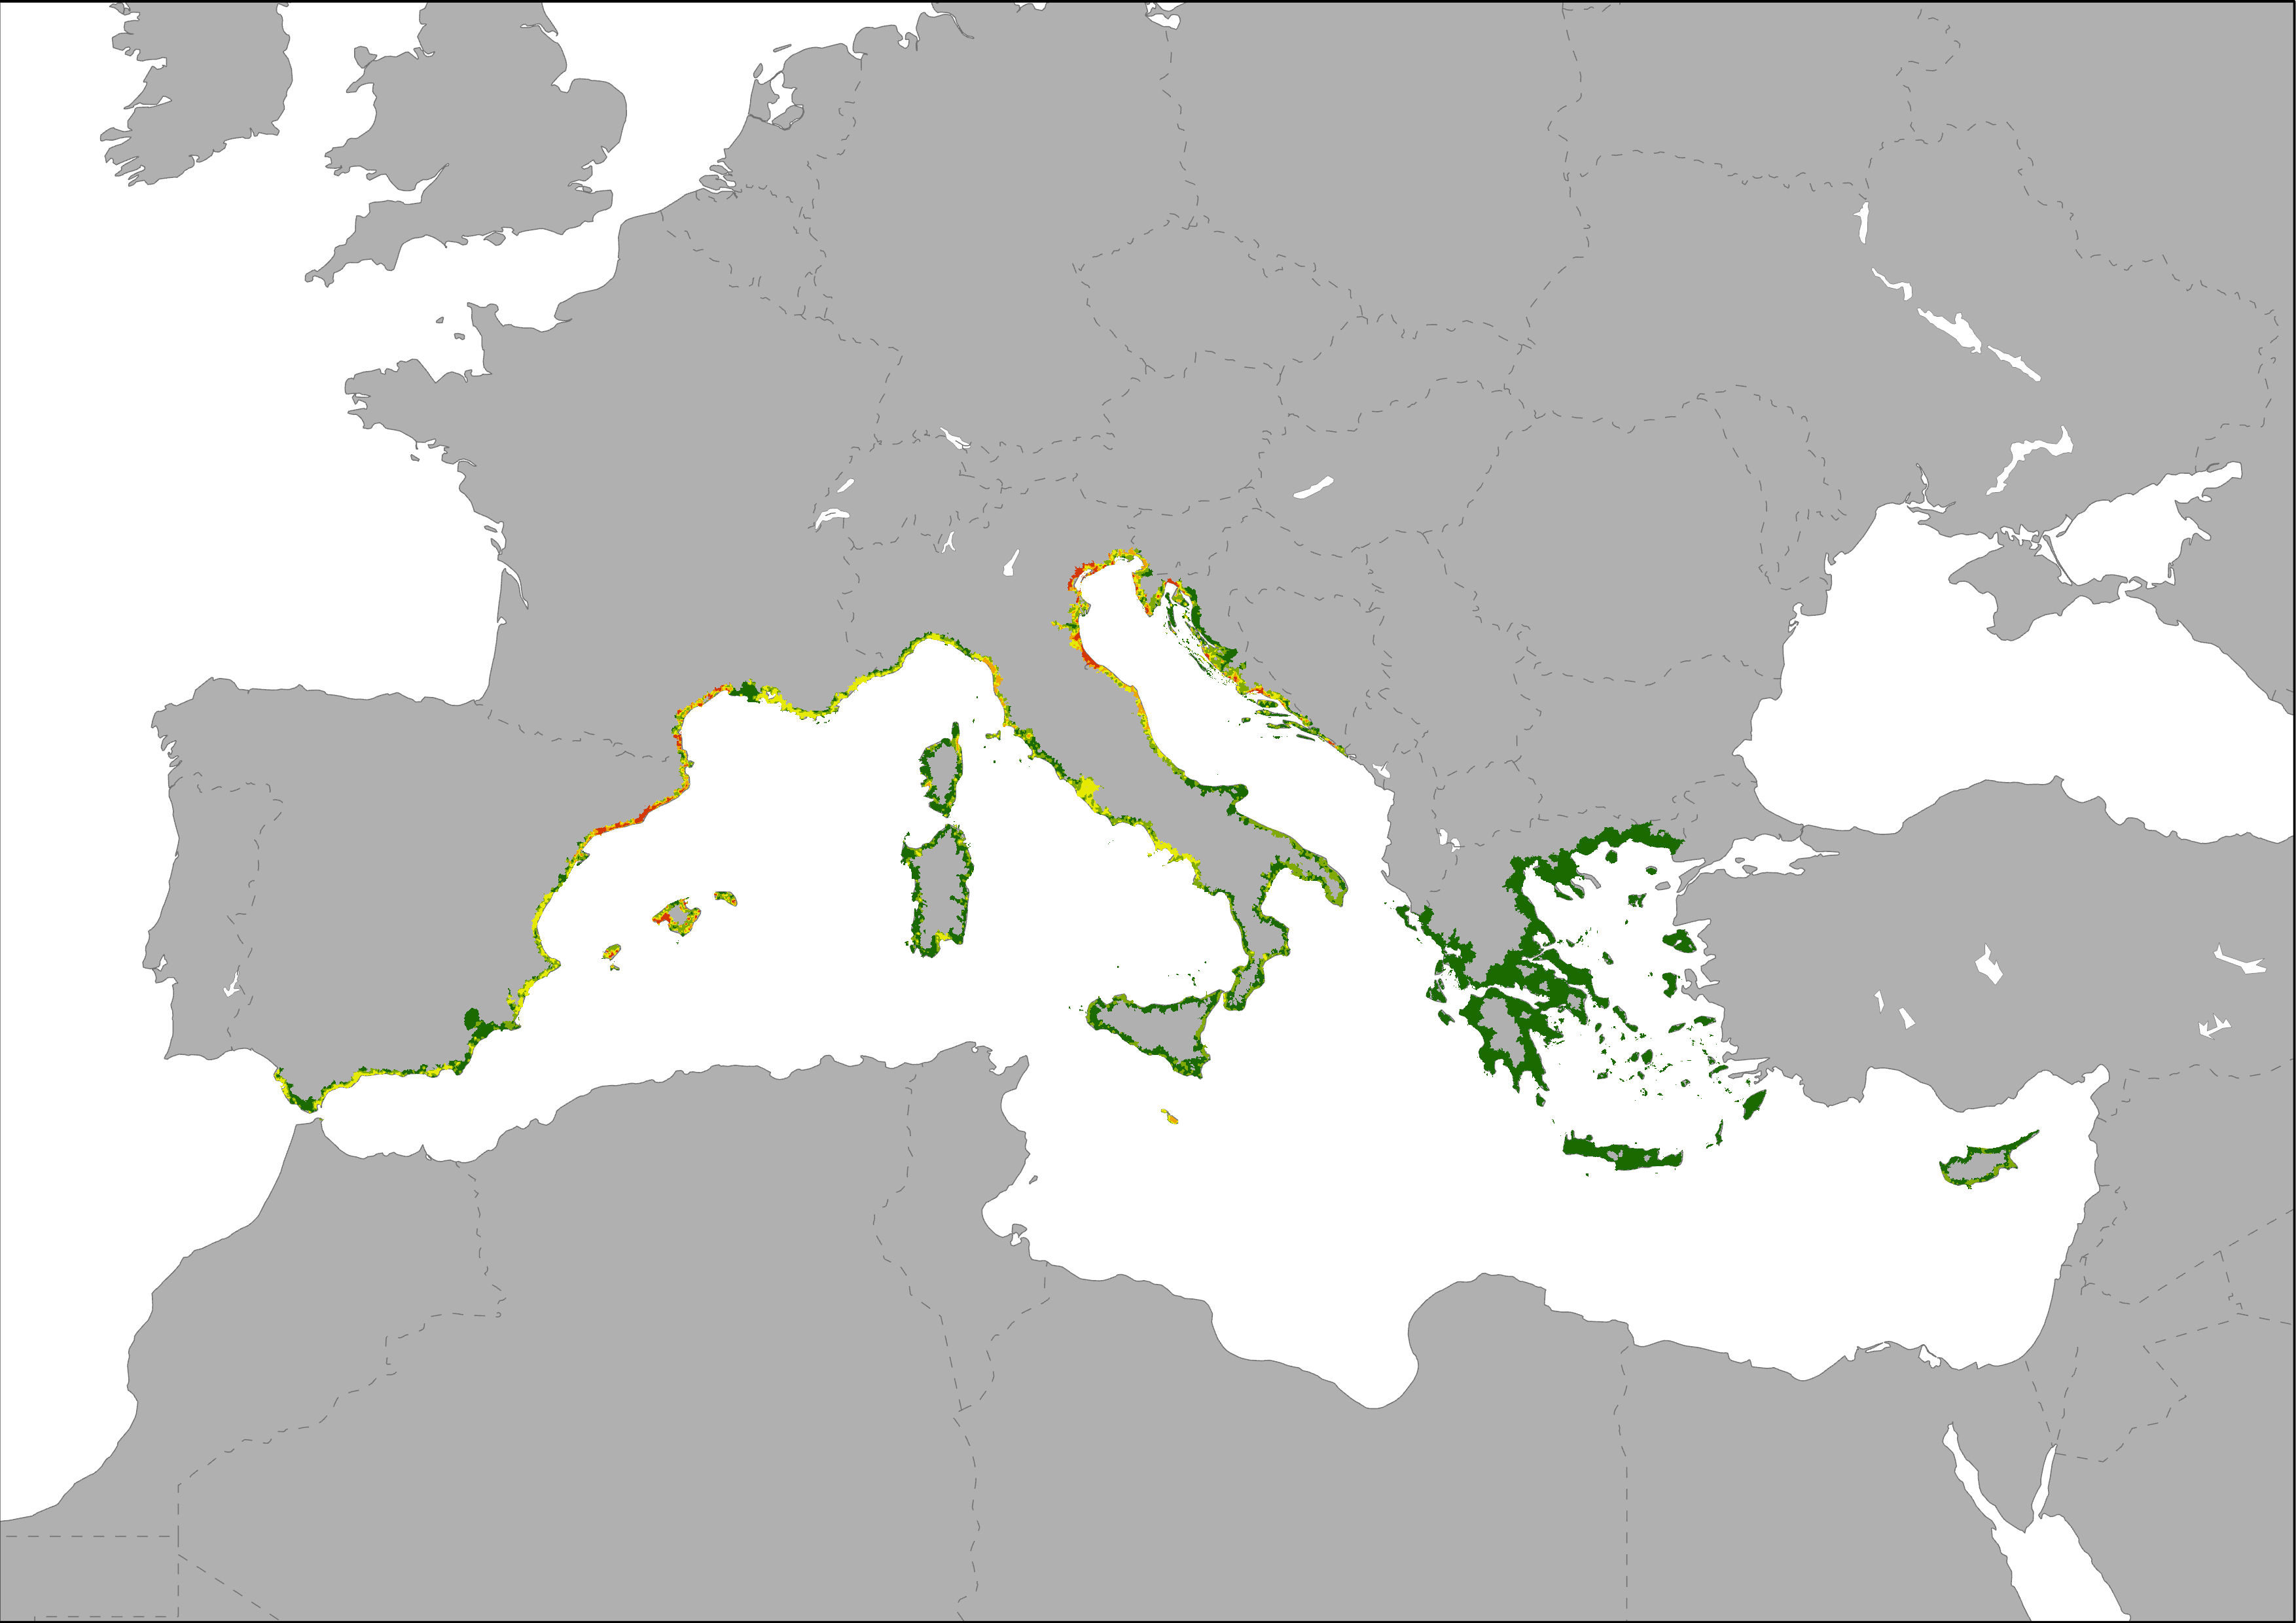
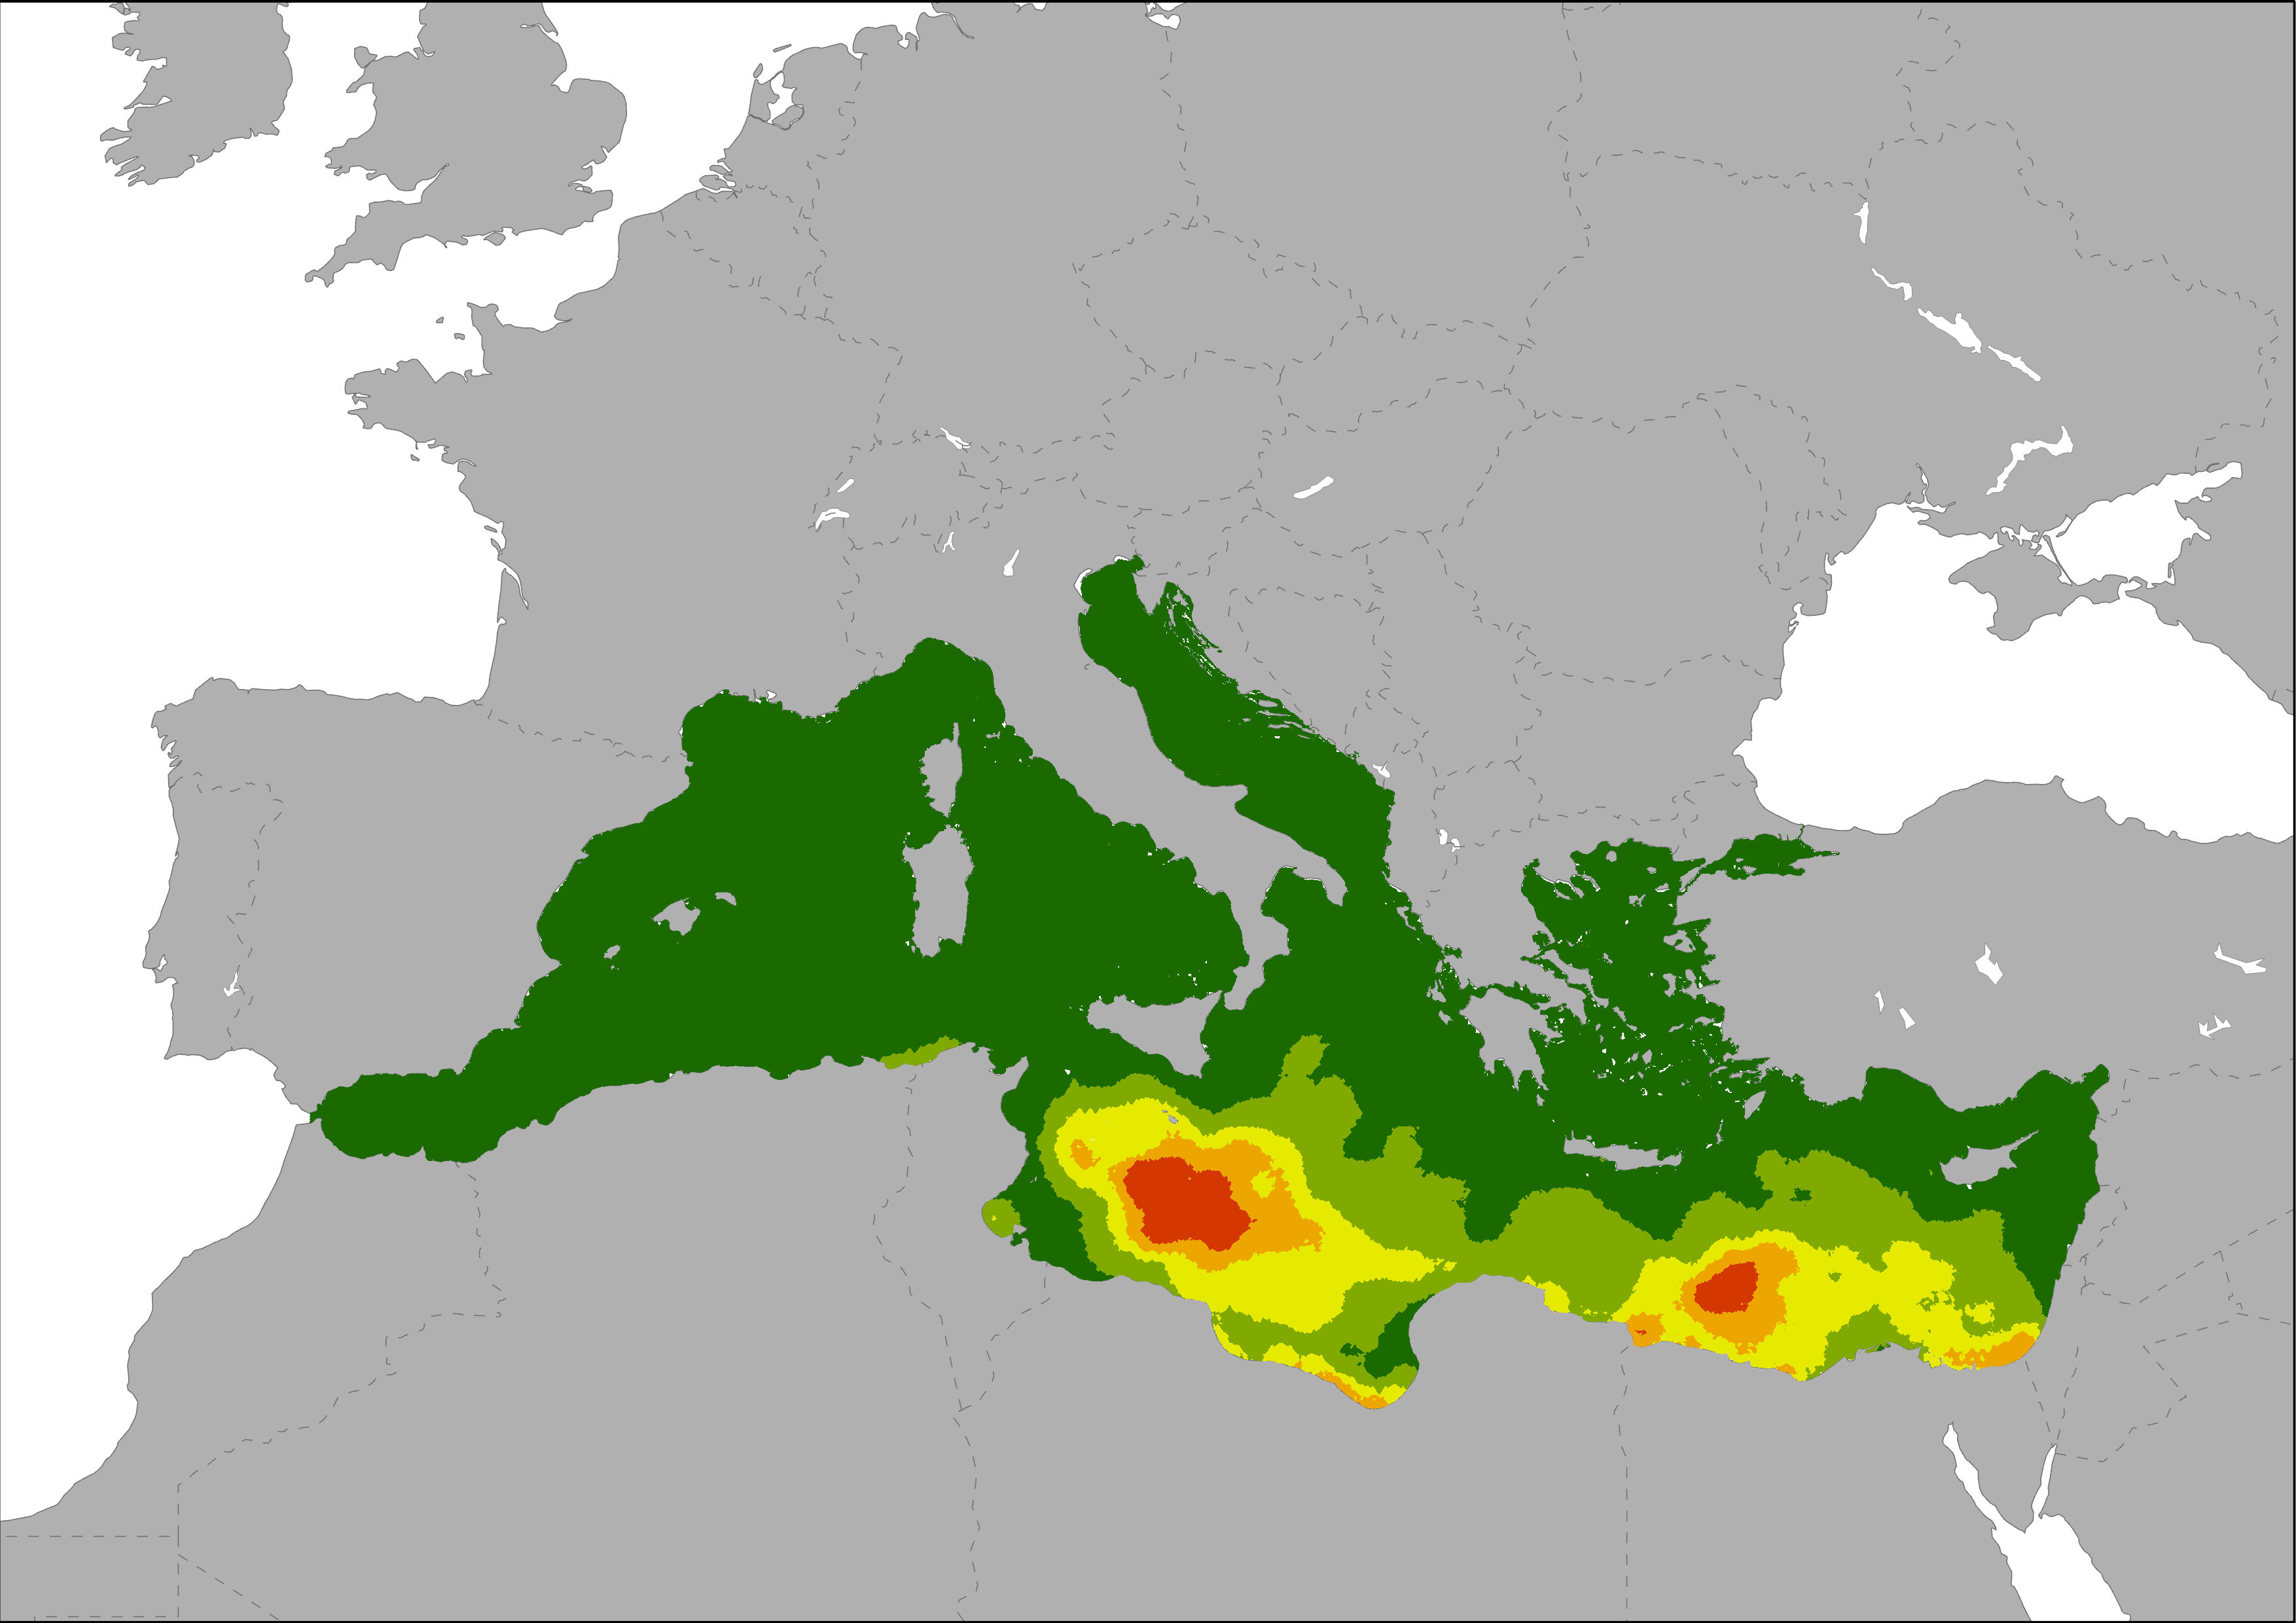
Map representing the number of establishments per km2, as an indicator of the local intensity of tourism capacity. This pressure index is based on Eurostat tourism statistic on number of tourism accommodation establishments and the DMSP-OLS Nighttime Lights Time Series image. Eurostat's tourism capacity statistics differentiate between coastal and non-coastal areas within a NUTS2 region. The total number of establishments in coastal areas of a NUTS2 region was disaggregated to the most intense nighttime light emission pixels of the Nighttime Lights Time Series assuming that most bed places are located in areas with high nighttime light emissions. Results are showing low to high intensive tourism capacity per km2 pixel.
-
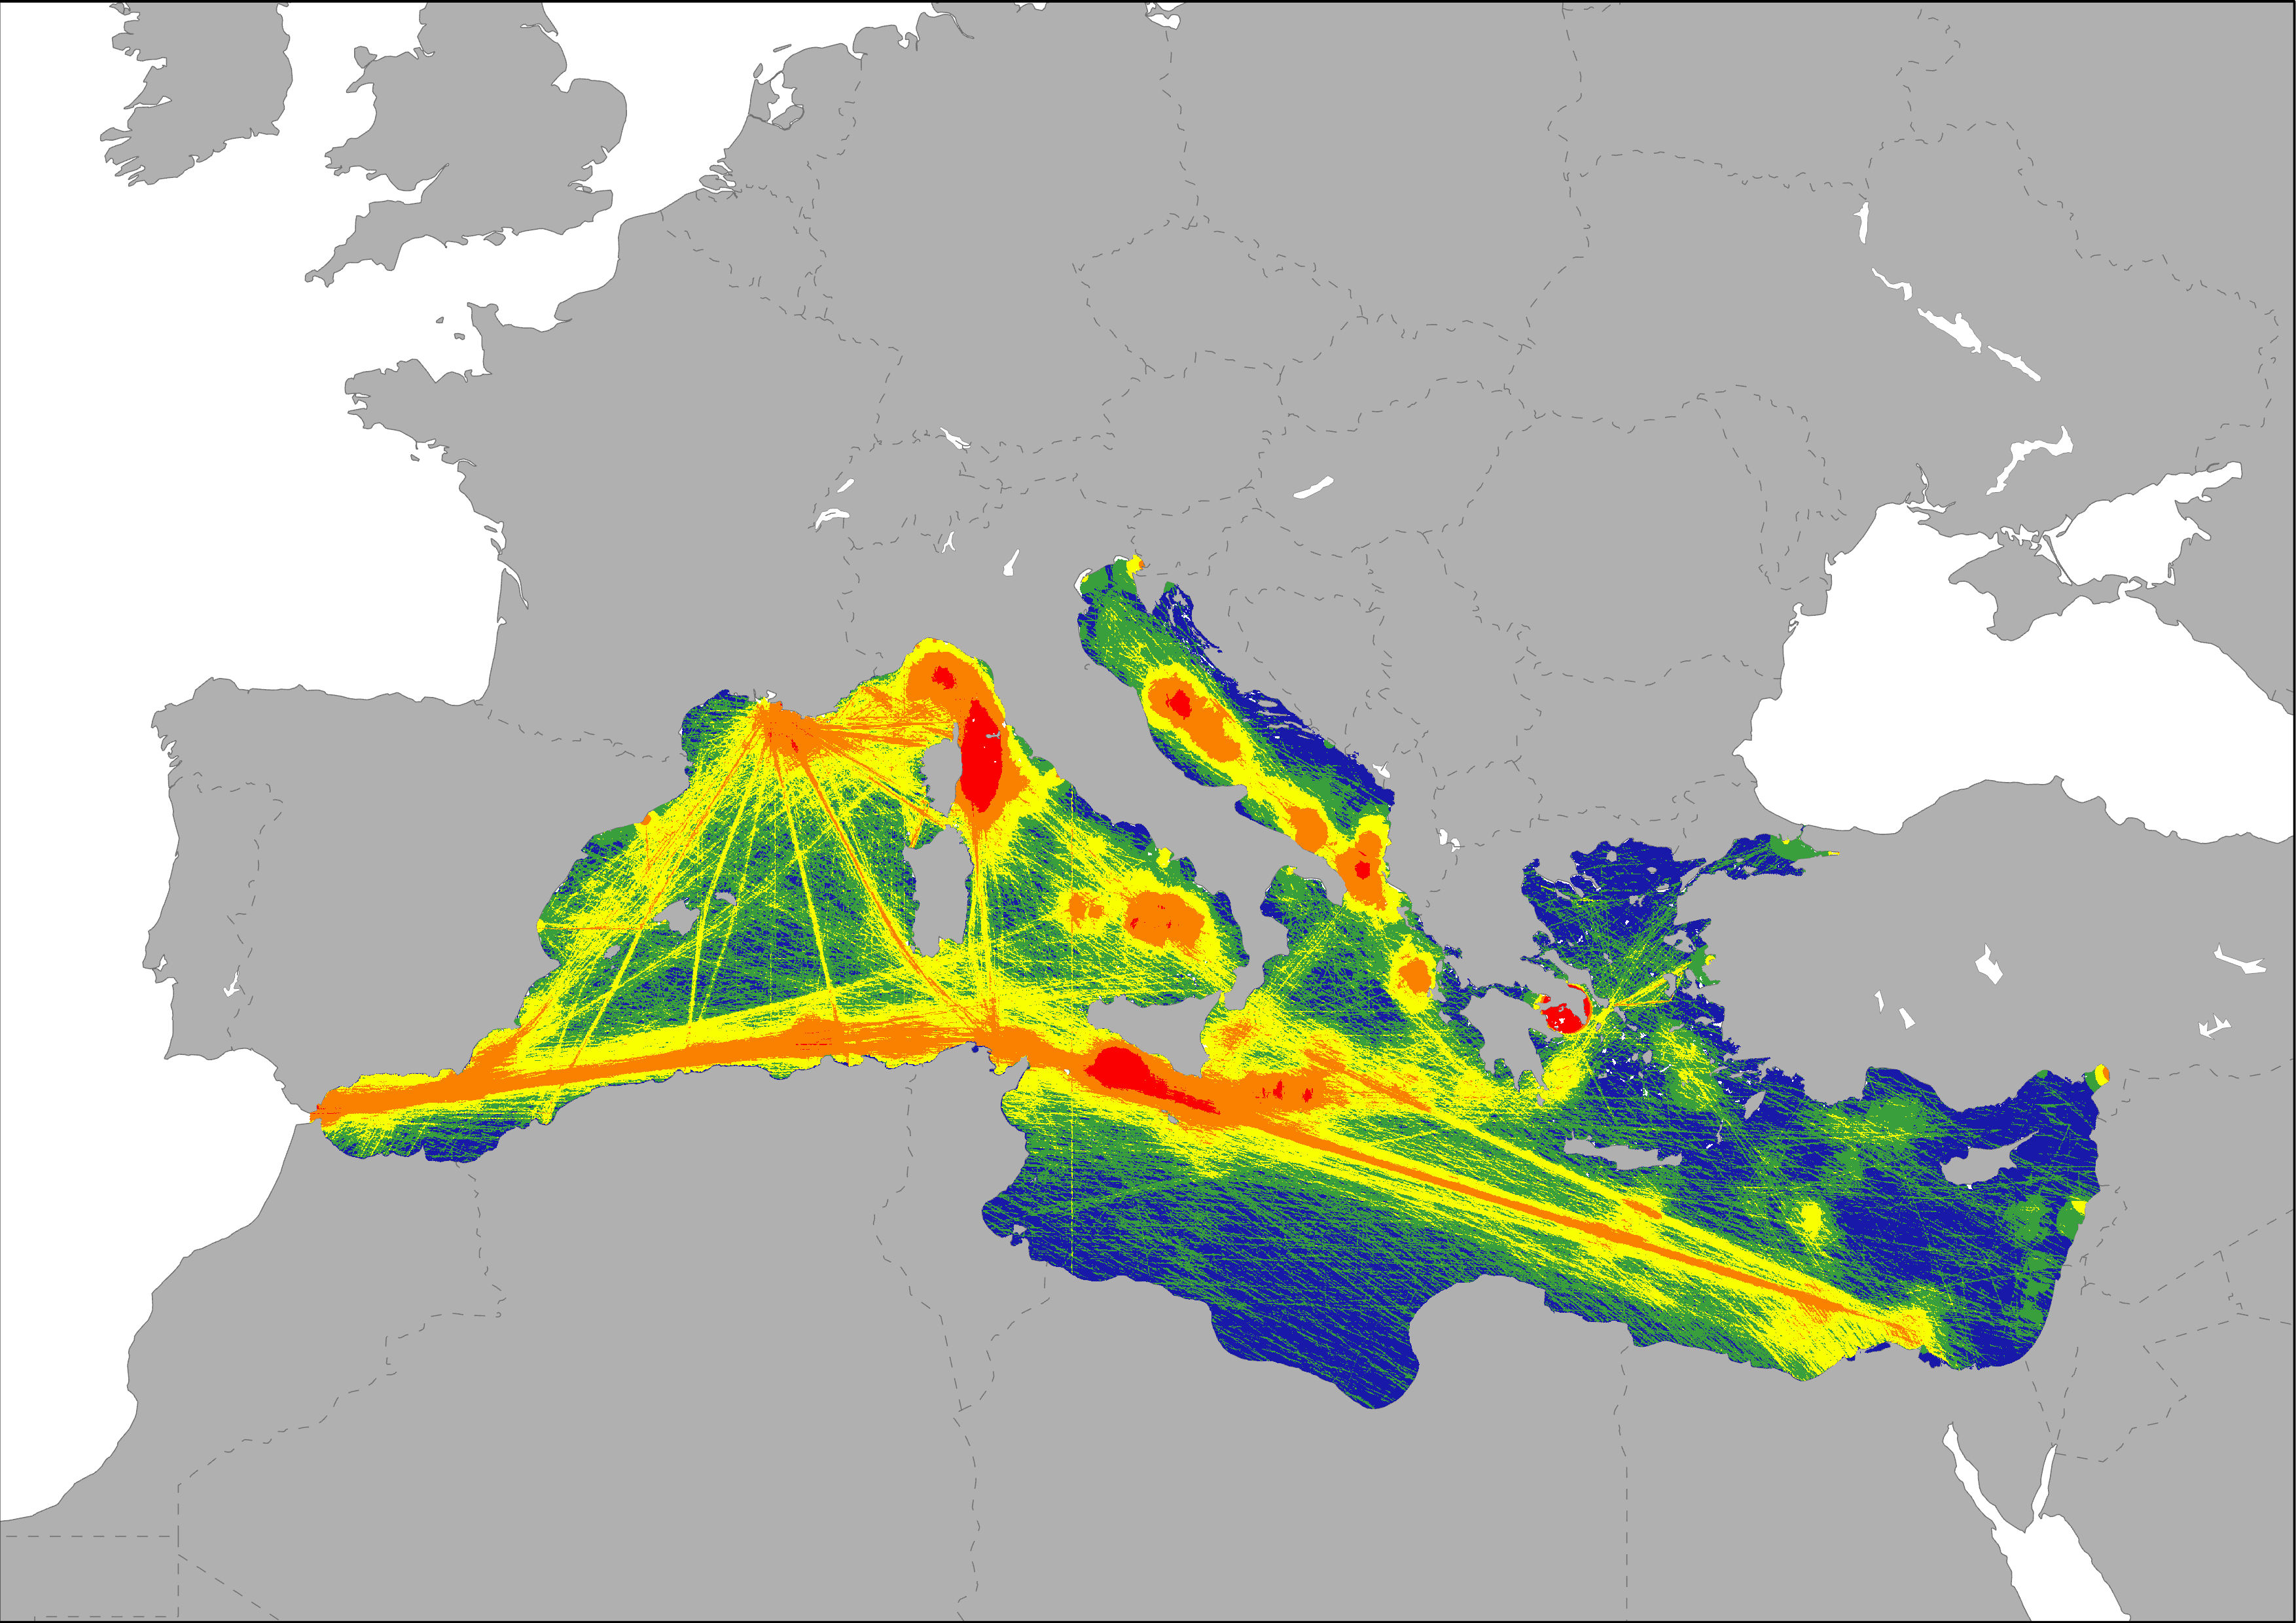
Data representing the cumulative tourism pressure in Mediterranean Sea waters based on the intensity of maritime traffic of passengers vessels and pleasure craft. Traffic intensity was produced using AIS data aggregated at 1km2 by EMODnet and expressed as total time with presence of vessels in each cell throughout the year (hours/km2). Pressure hotspots are highlighted on the map, being classified as: 1) low; areas with cumulative presence of vessels from one hour a day to 4 months (1 quarter); 2) moderate; areas with cumulative presence of vessels between 4 and 8 months (1 to 2 quarters); 3) high, areas with cumulative presence of vessels between 8 months (2 quarters) and one year; 4) very high, areas where there is a cumulative presence of vessels exciding one year, being locations of very high traffic intensity.
-
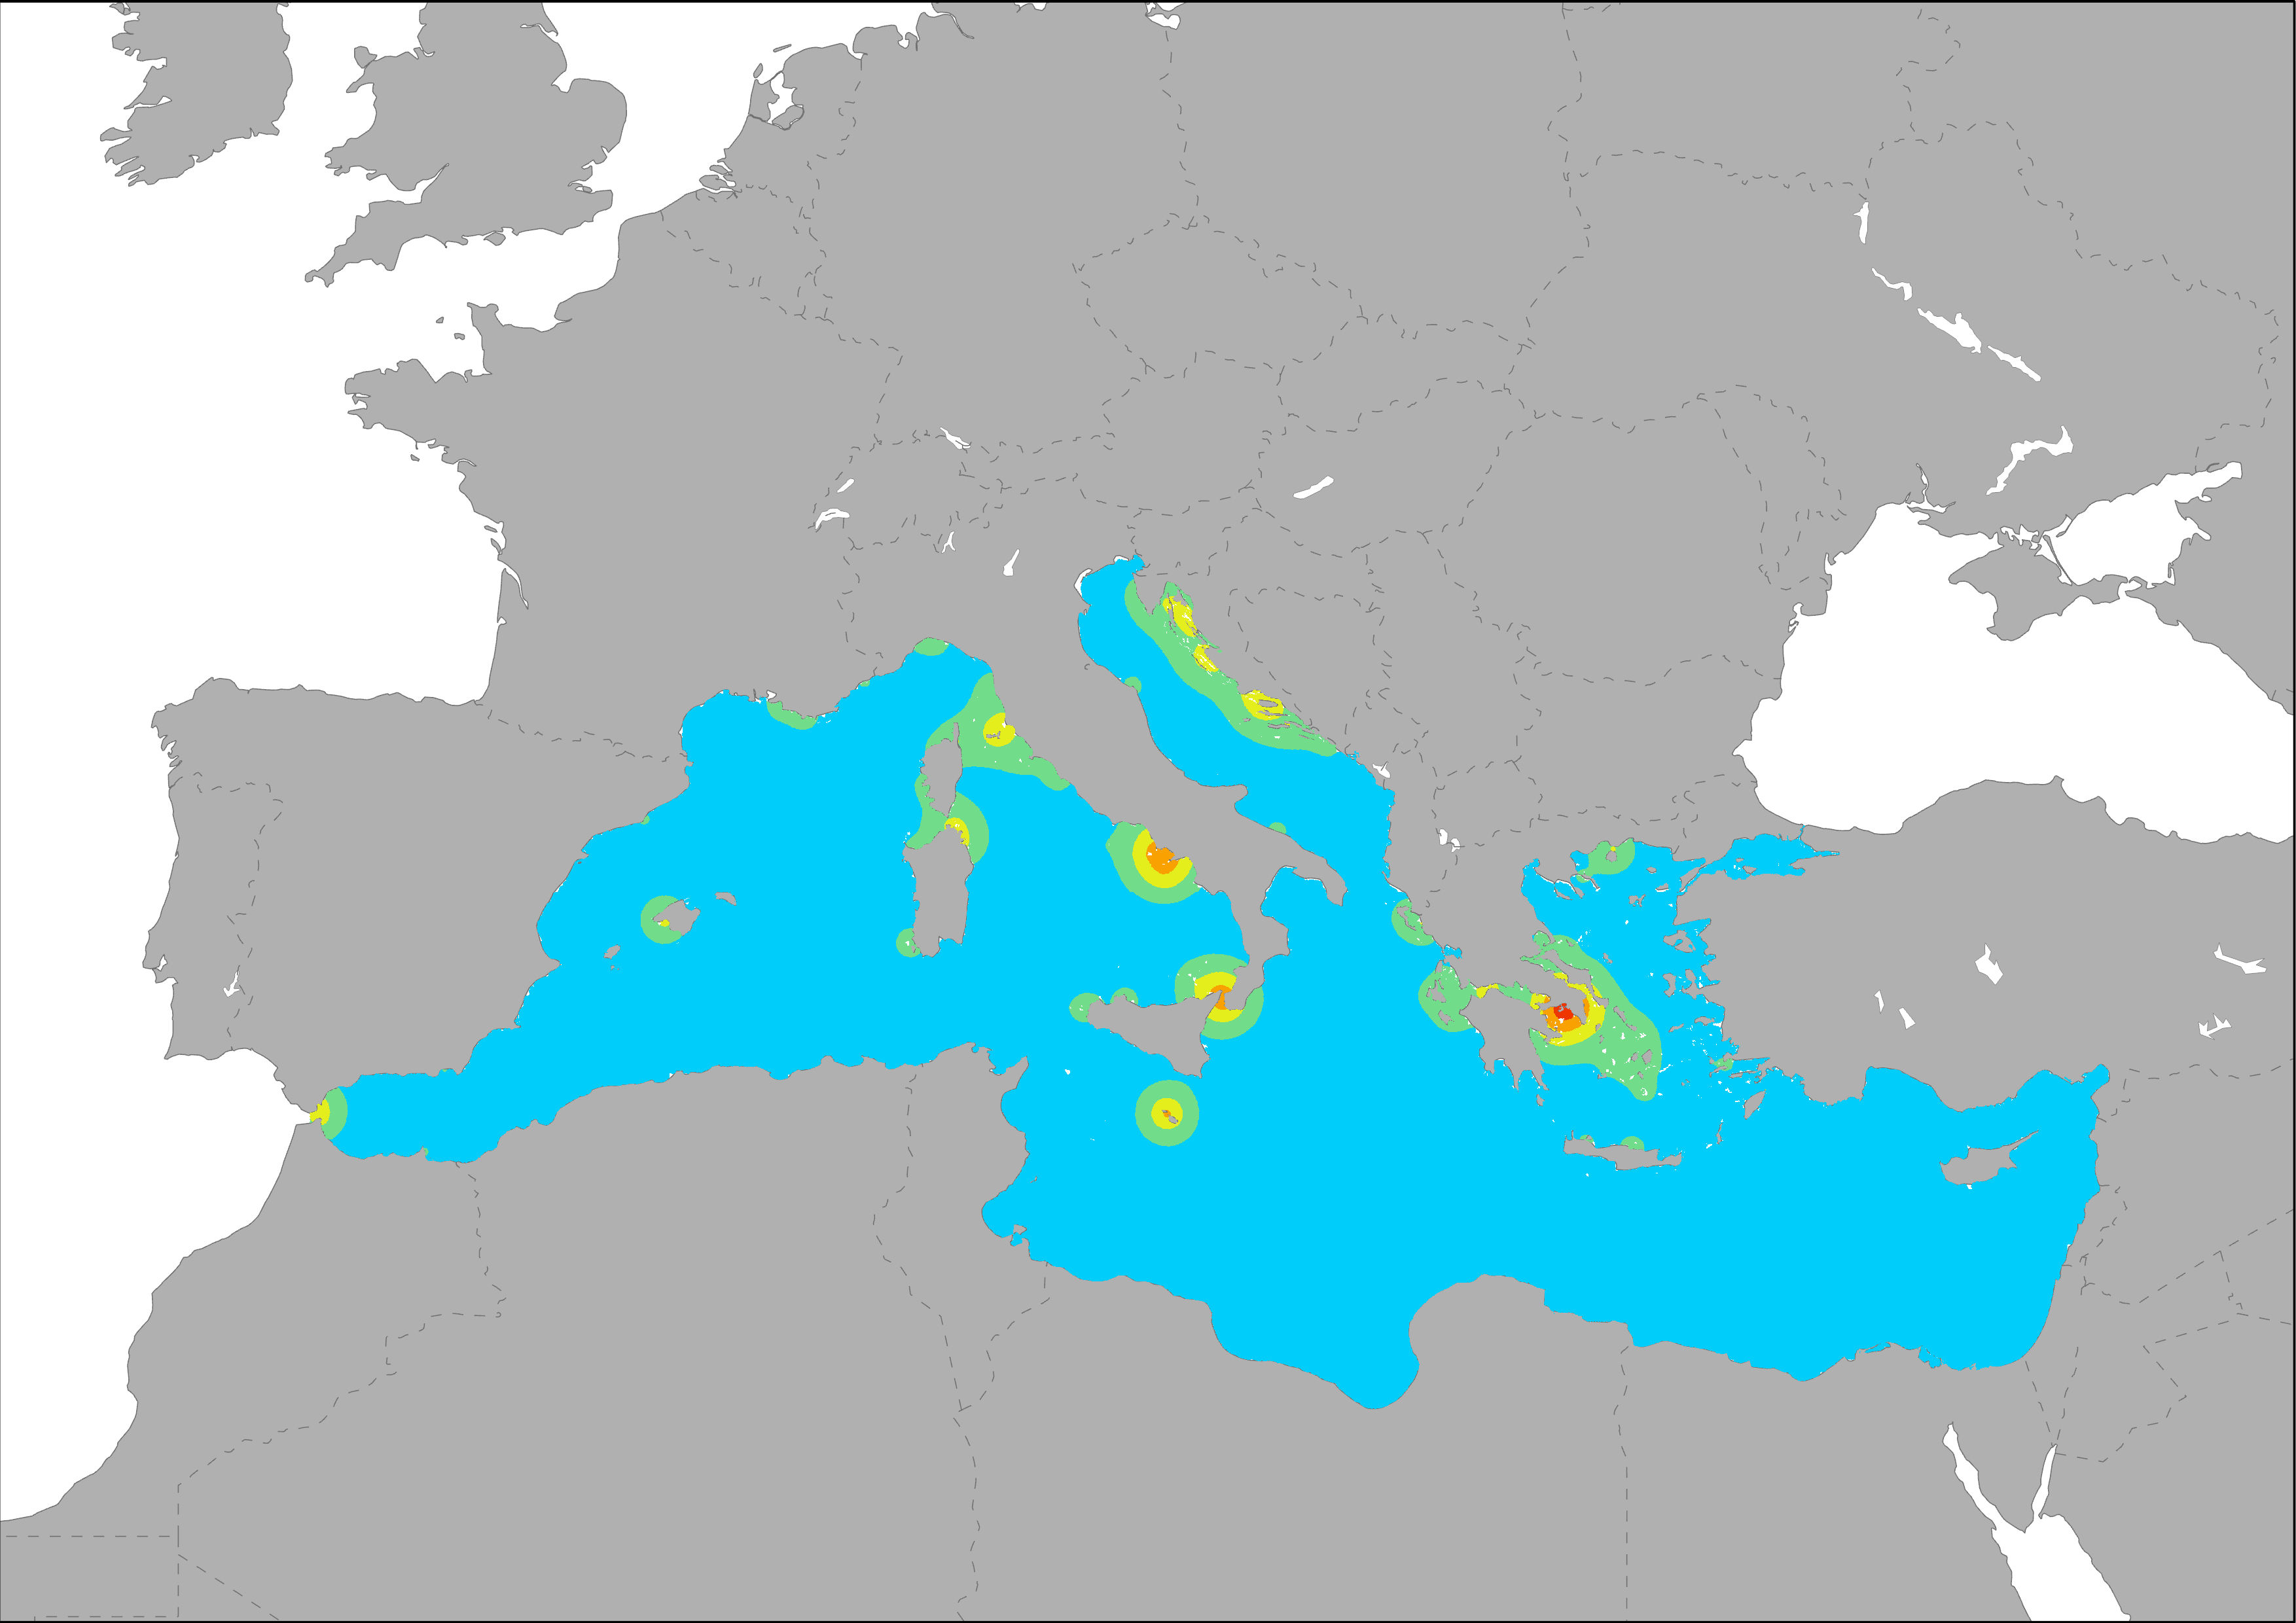
The map highlight the potential intensity of pressure related to marinas on marine ecosystems. The dispersal of yachting port-derived pollution was modeled as a diffusive plume up to 20 km based on the data on mooring capacity of each yachting port. The spatial proximity of yachting ports increases the overall pressures. The influence was modeled as a buffer with and exponential decay based on self calculations using mooring capacity of each yachting port. Calculations were made following the same methodology developed for ESaTDOR Project (ESPON, 2013). The extension area is based on HELCOM, 2012 and it is the theoretical maximum expansion distance for pressures generated by recreational shipping.