
Type of resources
Available actions
Topics
Keywords
Contact for the resource
Provided by
Years
Formats
Representation types
Update frequencies
Status
Service types
Scale
Resolution
panaceaKeywords
GEMET keywords
-
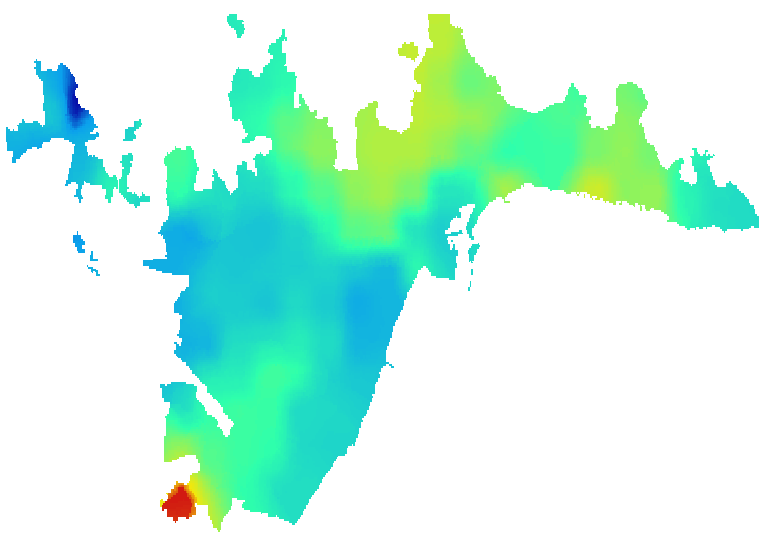
Representación del efecto Isla de Calor Urbana mediante la oscilación térmica media invernal nocturna por grandes barrios en la ciudad de Málaga desde 2003 a 2023. Para la elaboración de la presente información se han utilizado datos MODIS para el cálculo de la diferencia de temperatura entre área urbana y áreas colindantes. Concretamente se utilizan los datos LST (el término "LST" en el contexto de MODIS se refiere a "Land Surface Temperature" en inglés, que significa "Temperatura de la Superficie Terrestre" en español) derivados de MODIS de TERRA (MOD11A2) y AQUA (MYD11A2), disponibles con una resolución de 1000 m × 1000 m. Solo se procesan los píxeles con cielo despejado (nubosidad 0%) para no meter ruido en los cálculos de medias de temperatura. La franja horaria diurna analizada comprende desde las 01:30 a las 10:30 horas, recopilando datos de diciembre, enero y febrero desde el 2003 hasta el 2023 (20 años). En este caso, se ha realizado la diferencia en LST de los píxeles urbanos y los píxeles no urbanos dentro de una extensión urbana, en este caso la definida como entorno urbano de Málaga. Los datos de la capa pueden utilizarse para identificar las áreas urbanas que son más propensas a experimentar el efecto isla de calor en la Ciudad de Málaga.
-

The map shows the distribution of main fishing ports in the Mediterranean Sea. Ports are ranked by tonnage per vessel (total gross tonnage, GT/number of vessels). This indicator is based on fleet stats of DG MARE, 2014.
-
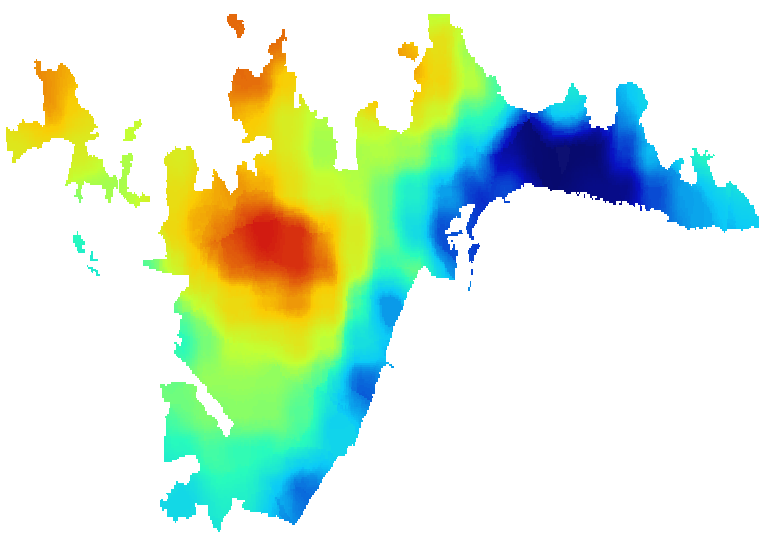
Representación del efecto Isla de Calor Urbana mediante la oscilación térmica media estival diurna por grandes barrios en la ciudad de Málaga desde 2003 a 2023. Para la elaboración de la presente información se han utilizado datos MODIS para el cálculo de la diferencia de temperatura entre área urbana y áreas colindantes. Concretamente se utilizan los datos LST (el término "LST" en el contexto de MODIS se refiere a "Land Surface Temperature" en inglés, que significa "Temperatura de la Superficie Terrestre" en español) derivados de MODIS de TERRA (MOD11A2) y AQUA (MYD11A2), disponibles con una resolución de 1000 m × 1000 m. Solo se procesan los píxeles con cielo despejado (nubosidad 0%) para no meter ruido en los cálculos de medias de temperatura. La franja horaria diurna analizada comprende desde las 13:30 a las 22:30 horas, recopilando datos de los meses de junio, julio y agosto desde el 2003 hasta el 2023 (20 años). En este caso, se ha realizado la diferencia en LST de los píxeles urbanos y los píxeles no urbanos dentro de una extensión urbana, en este caso la definida como entorno urbano de Málaga. Los datos de la capa pueden utilizarse para identificar las áreas urbanas que son más propensas a experimentar el efecto isla de calor en la Ciudad de Málaga.
-
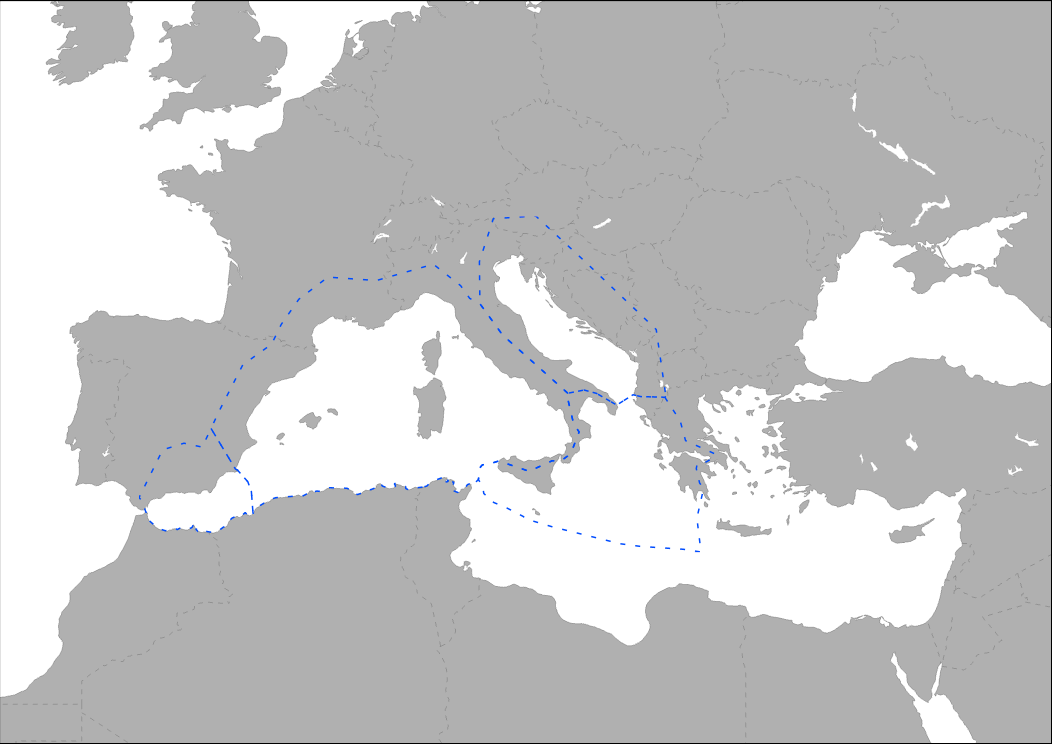
Med-IAMER project covers two main regions: the Western Mediterranean, including the Alboran Sea, as one study area and the Adriatic and Ionian Sea as the other study area. Both areas are represented by the boundaries defined by the Marine Ecoregions of the World (MEOW, Spalding et al. 2007). The ecoregion concept has been used for as these boundaries best represent the ecological differences in the Mediterranean.
-
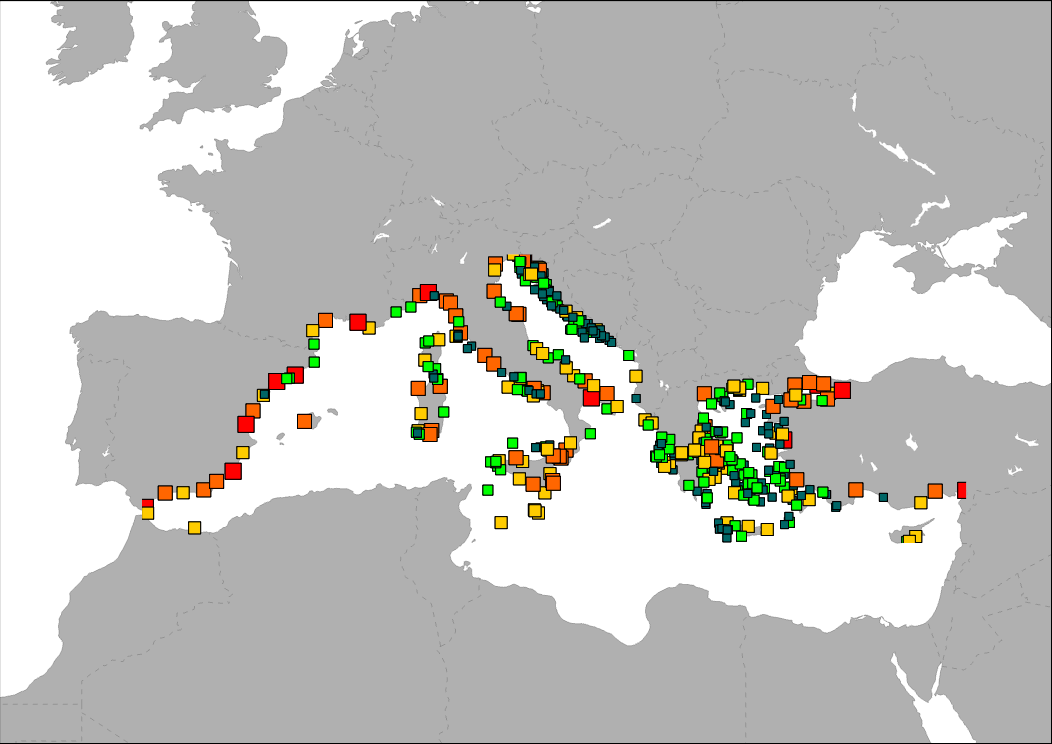
The map shows the distribution of main goods transport ports in the Mediterranean Sea. Ports are classified in groups according to its level of activity.
-

The layer shows type and location of pilot sites involved in MPAs project. MPAs is an Integrated territorial Project of the biodiversity protection community funded by the Interreg Med Programme.
-
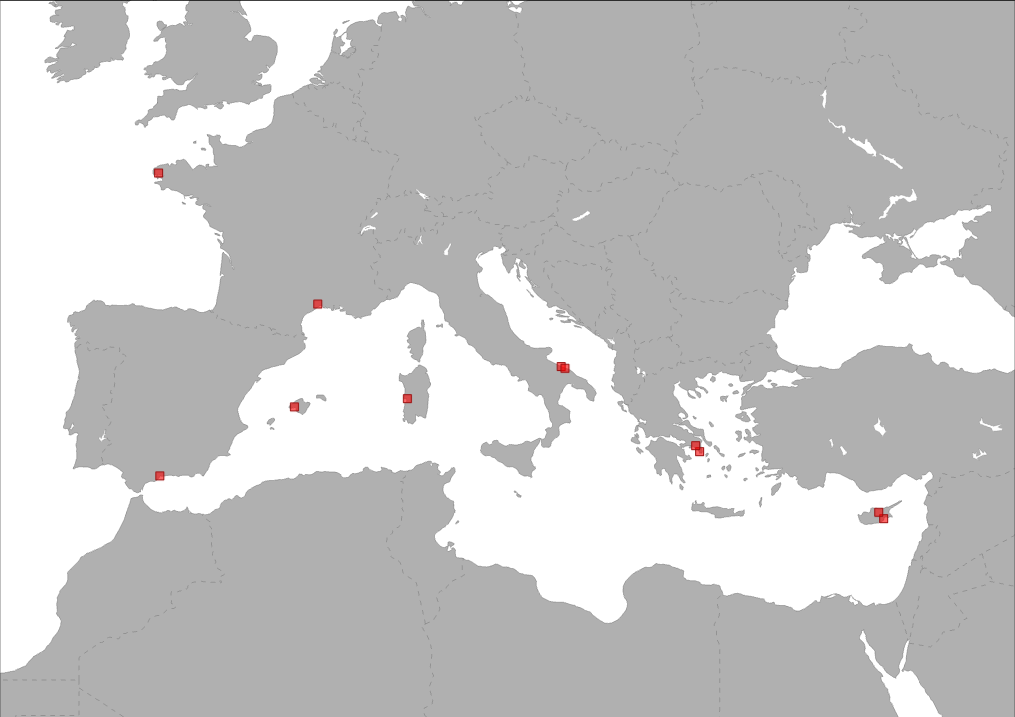
The layer shows type and location of partners involved in POSBEMED project. POSBEMED is a Study Project of the biodiversity protection community funded by the Interreg Med Programme. The POSBEMED project deals with “Sustainable management of the systems Posidonia-beaches in the Mediterranean region”.
-

The indicator of legal protection was made by summing all the legal designation categories (based on MAPAMED, the database on Mediterranean Marine Protected Areas, MedPAN, RAC/SPA, 2014) overlapping on each 1ha pixel across the whole Mediterranean Sea.
-
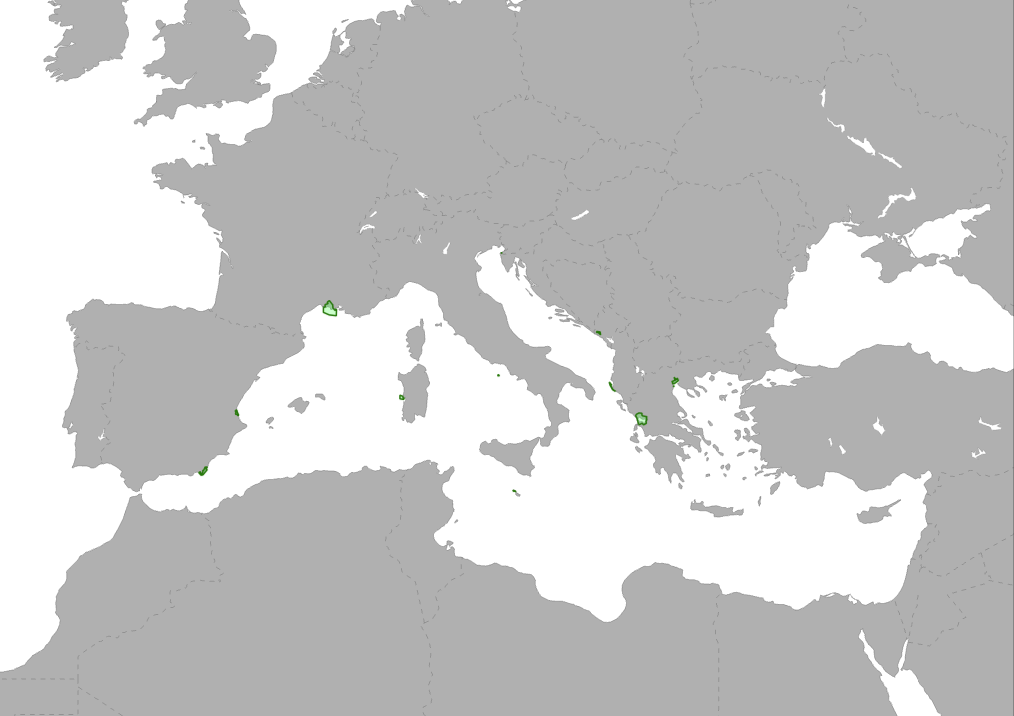
The layer shows type and location of partners involved in TUNE UP project.
-

The layer shows the location of pilot sites involved in POSBEMED 2 project.